The year 2022 marks the fourth time over the past five years the Islamophobia Index was measured in the American Muslim Poll (beginning in 2017). The Islamophobia Index is a measure of the level of public endorsement of five false, negative stereotypes associated with Muslims in America. These are the items used to construct the index:
Please indicate how much you agree or disagree with the following statements, where 1 means you strongly disagree and 5 means you strongly agree in regard to most Muslims living in the United States.
Most Muslims living in the United States are more prone to violence than other people.
Most Muslims living in the United States discriminate against women.
Most Muslims living in the United States are hostile to the United States.
Most Muslims living in the United States are less civilized than other people.
Most Muslims living in the United States are partially responsible for acts of violence carried out by other Muslims.
ISPU analysts chose these five variables based on previous research [2] linking these perceptions with greater tolerance for anti-Muslim policies such as mosque surveillance, racial profiling, and greater scrutiny of Muslims at airports, the so-called Muslim Ban, and even taking away voting rights from Americans who are Muslims. These five measures are not meant to cover the totality of public Islamophobia, which can and does include many other false beliefs about Muslims. They are instead meant to offer an evidence-based measure of five perceptions known to be linked to acceptance of discriminatory policies.
Answers to this battery of questions were used to construct an additive scale that measures overall anti-Muslim sentiment. [3] The resulting Islamophobia Index provides a single metric that is easy to understand, compare, and track over time. The Islamophobia Index measures the endorsement of anti-Muslim stereotypes (violent, misogynist), perceptions of Muslim aggression toward the United States, degree of Muslim dehumanization (less civilized), and perceptions of Muslim collective blame (partially responsible for violence), all of which have been shown to predict public support for discriminatory policies toward Muslims. [4]
It is noteworthy that this index, while called simply the “Islamophobia Index,” only measures anti-Muslim sentiment among the public and not the degree to which Islamophobia is institutionalized by the state. Islamophobia is not simply a phenomenon of societal sentiment, but is a structural phenomenon, manifesting in legislation, budget decisions, and law enforcement practices at the local, state, and federal levels. While our index does not measure structural Islamophobia, public tolerance for many of these practices is linked to higher scores on the Islamophobia Index. [5]
Islamophobia is not simply a phenomenon of societal sentiment, but is a structural phenomenon, manifesting in legislation, budget decisions, and law enforcement practices at the local, state, and federal levels.
Muslims Climb in Islamophobic Beliefs as Other Groups Drop
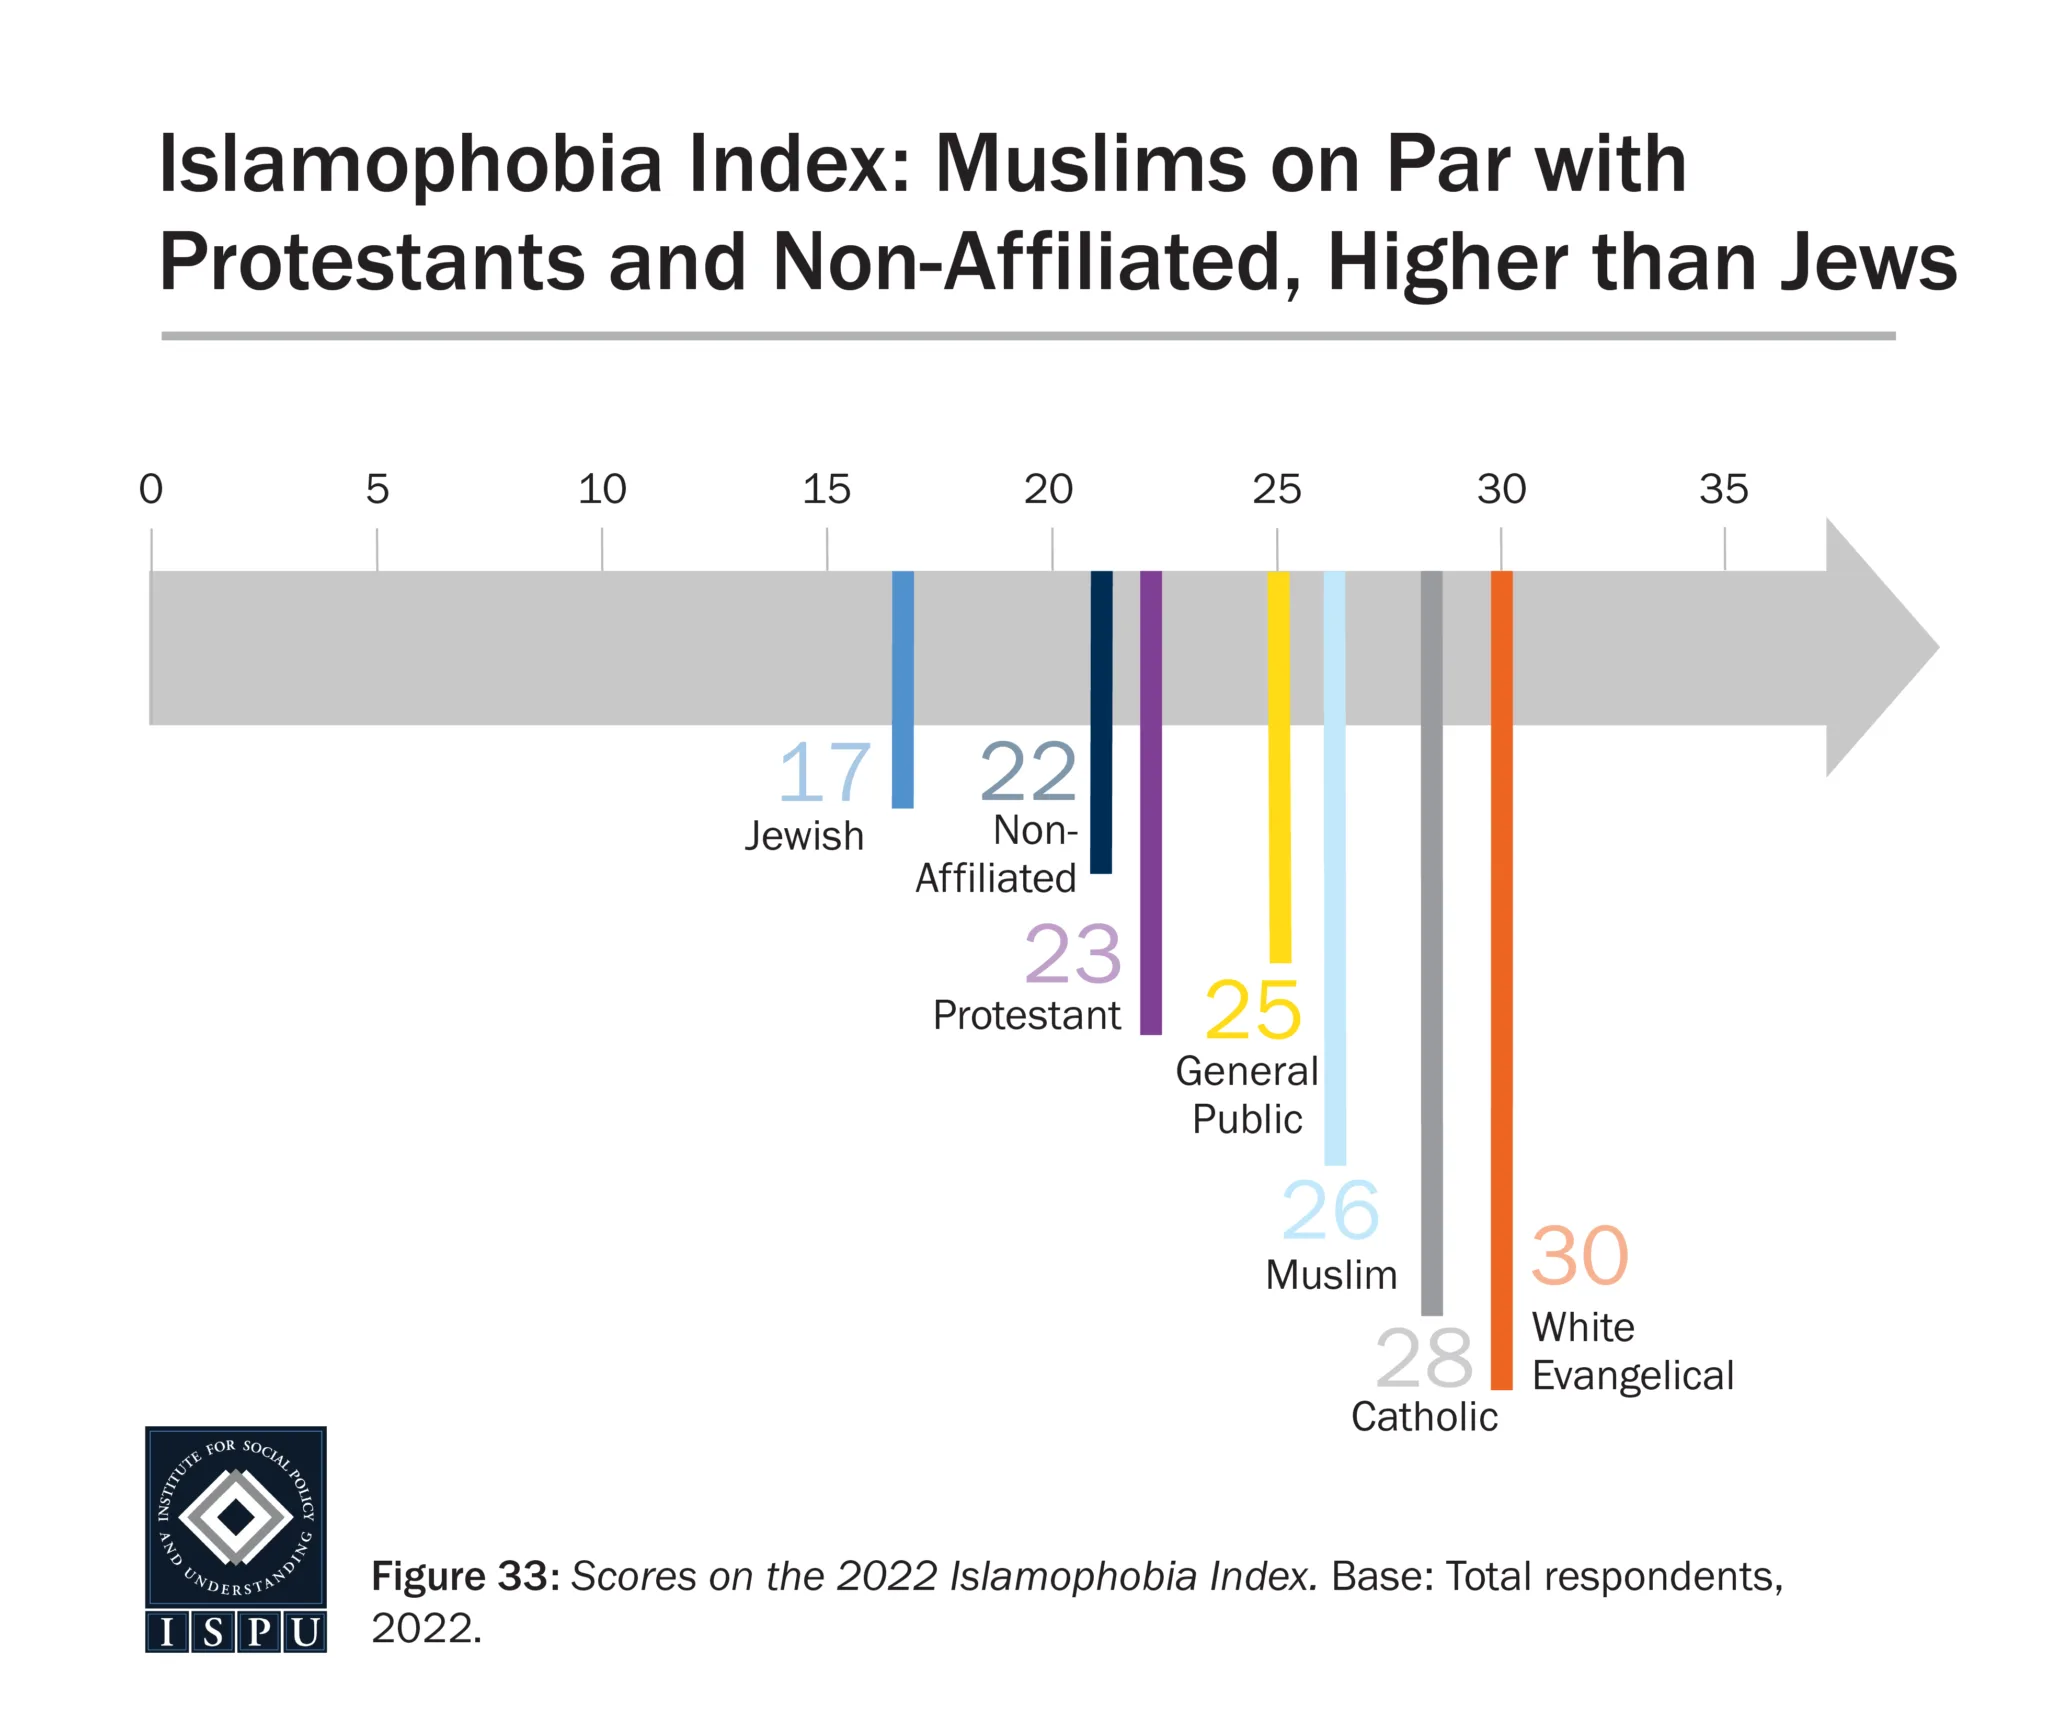
In 2022, the general public scored 25 on the Islamophobia Index (on a scale of 0-100), compared to 27 in 2020. With an Islamophobia Index score of 17, Jewish Americans were the lowest among all faith groups, including Muslims who scored 26. Protestants (23) and the nonaffiliated (22) scored similarly, while Catholics (28) and white Evangelicals (30) were highest.
In 2020, we noted a significant decline in Islamophobia among Jewish Americans since 2018. In 2022, we find Islamophobia is on the decline among other groups, but not among Muslims. Protestants have declined from a score of 26 in 2018 to 23 in 2022 and white Evangelicals from a score of 40 in 2018 to 30 in 2022. While the general public had a lower score in 2022 (25) compared with 2019 (28), scores have remained relatively stable since 2018 (24). Catholics have increased from a score of 22 in 2018 to 28 in 2022 but remained stable since 2020 when they scored 29.
For Muslims, scores on the Islamophobia Index have increased from 18 in 2018 to 26 in 2022. Between 2020 and 2022, the score increased six points from 20 to 26. Further analysis reveals that higher Islamophobia Index scores among Muslims are driven primarily by Muslims who identify as white.
For Muslims, scores on the Islamophobia Index have increased from 18 in 2018 to 26 in 2022.
A line graph showing scores on the Islamophobia Index from 2018 – 2022 for each group surveyed.
Looking at Islamophobia Index scores by race/ethnicity, we find the largest increase among white Muslims. In 2018, white Muslims scored 21 and remained stable in 2019 (20). In 2020, white Muslims showed increased Islamophobia with a score of 27, followed by an even larger increase in 2022 with a score of 40. Further research is needed to explain why there has been such a large increase in Islamophobia among white Muslims. Among Black, Asian, and Arab Muslims, Islamophobia Index scores remained stable between 2018 and 2022. Similarly, among the general public, Islamophobia Index score remained stable between 2018 and 2022 among white, Black, and Hispanic Americans.
A line graph showing scores on the Islamophobia Index for Muslim racial/ethnic groups from 2018 – 2022.A line graph showing scores on the Islamophobia Index among racial groups in the general public between 2018 – 2022.
Tropes Measured in the Islamophobia Index
Violence
The majority of Muslims disagree with the notion that Muslims are more prone to violence than other people (64%). However, Muslims, themselves, are by far the most Islamophobic group when it comes to the false notion that Muslims are more prone to violence than others. One-quarter of American Muslims (24%) somewhat or strongly agree with this trope, which is at least about two times more likely than other groups. In comparison, 9% of Jews, 8% of Catholics, 11% of Protestants, 12% of white Evangelicals, 13% of the nonaffiliated, and 9% of the general public agree with the idea that Muslims are more prone to violence than others. Self-identified white Muslims (35%) are more likely to agree compared with Black (18%) and Asian Muslims (16%). Roughly one-quarter of Arab Muslims (23%) agree that Muslims are more prone to violence than others.
A bar graph showing the proportion of all groups surveyed who agree or disagree with the false notion that most Muslims living in the US are more prone to violence than others.
Looking by age, we find that younger Muslims are particularly more likely than the oldest Muslims to agree with this trope. One-quarter of 18-29-year-olds (24%) and a third of 30-49-year-olds (33%) express agreement, compared with just 9% of 50+-year-old Muslims. This finding is especially noteworthy since younger Muslims formed their identity and self-perception in the past twenty years, a time when their community was a target of law enforcement and politicians.
Comparing respondents who were born into Islam with Muslims who were not born into the faith, converts were far less likely to endorse this stereotype. More than one-quarter of born Muslims (27%) report agreement compared with 11% of Muslims not born in the faith. These findings suggest the internalized Islamophobia that has possibly resulted, in part, from two decades of collective blame since the 9/11 attacks.
Misogyny
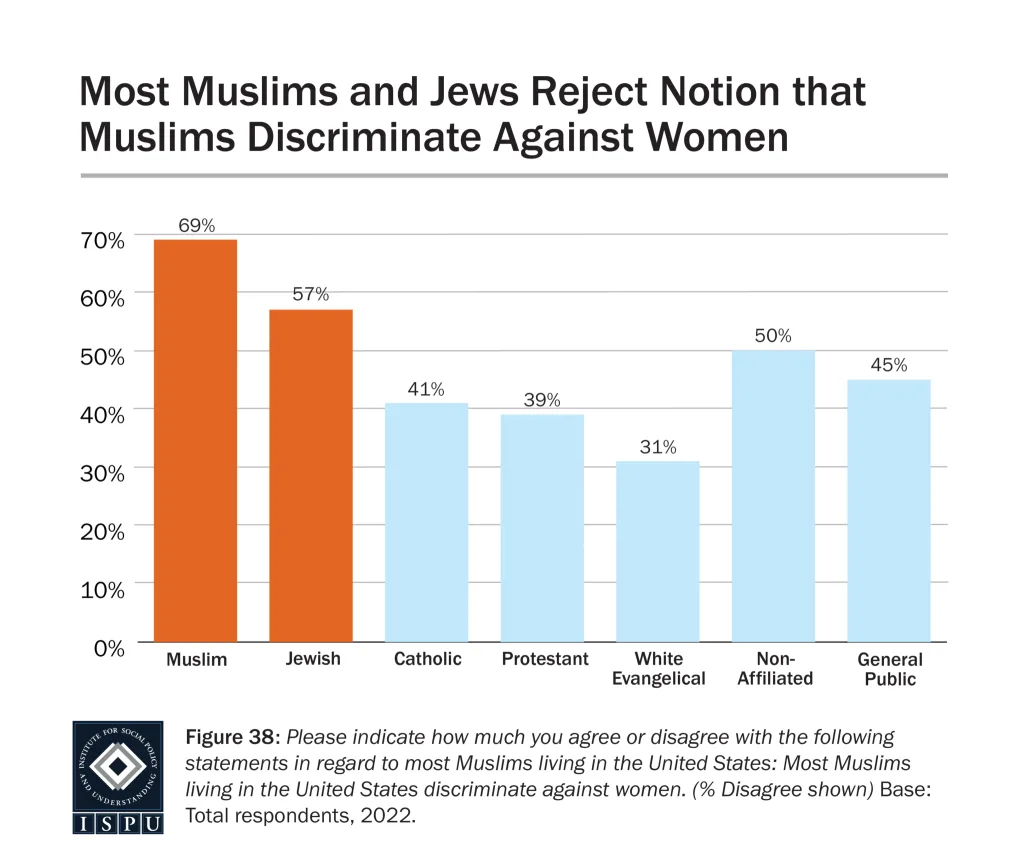
Unlike the level of agreement with the stereotype that Muslims are violent, at 69% Muslims are among the most likely to disagree with the trope of misogyny (that ‘most Muslims living in the United States discriminate against women’). In comparison, 57% of Jews, 41% of Catholics, 39% of Protestants, 31% of white Evangelicals, 50% of the nonaffiliated, and 45% of the general public disagree with this stereotype. When it comes to agreement with the idea that Muslims are inherently misogynistic, white Evangelicals are most likely to agree (32%). Roughly one in five Muslims (21%) agree with this trope, which is on par with 20% of Jews, 21% of Catholics, 24% of Protestants, 18% of the nonaffiliated, and 20% of the general public. Among Muslims, men and women express similar levels of agreement with the ideas that Muslims discriminate against women.
A bar graph showing the proportion of all groups surveyed who disagree with the false notion that most Muslims living in the US discriminate against women.
Looking by age, we find that 31% of Muslims aged 30-49 agree that Muslims in America discriminate against women, compared with 14% of 18-29-year-olds and 13% of 50+-year-olds (13%). Among the general public, the youngest (aged 18-29) are less likely than older individuals (30-49-year-olds and 50+-year-olds) to agree with the trope that Muslims are misogynistic (8% vs. 21% and 24%, respectively).
Analysis by race reveals that white Muslims (34%) are more likely than Black (19%), Asian (10%), and Arab Muslims (10%) to express agreement with the notion that Muslims discriminate against women. Black, white, and Asian Muslims are on par in their level of agreement. Racial/ethnic groups among the general public are also equally likely to agree that Muslims discriminate against women (15% of Black and Hispanic Americans and 23% of whites). As was found for the trope that Muslims are more prone to violence than other groups, Muslims born into the faith are more likely than those not born into the faith to agree that Muslims are misogynistic (23% vs. 10%, respectively).
Hostile to the United States
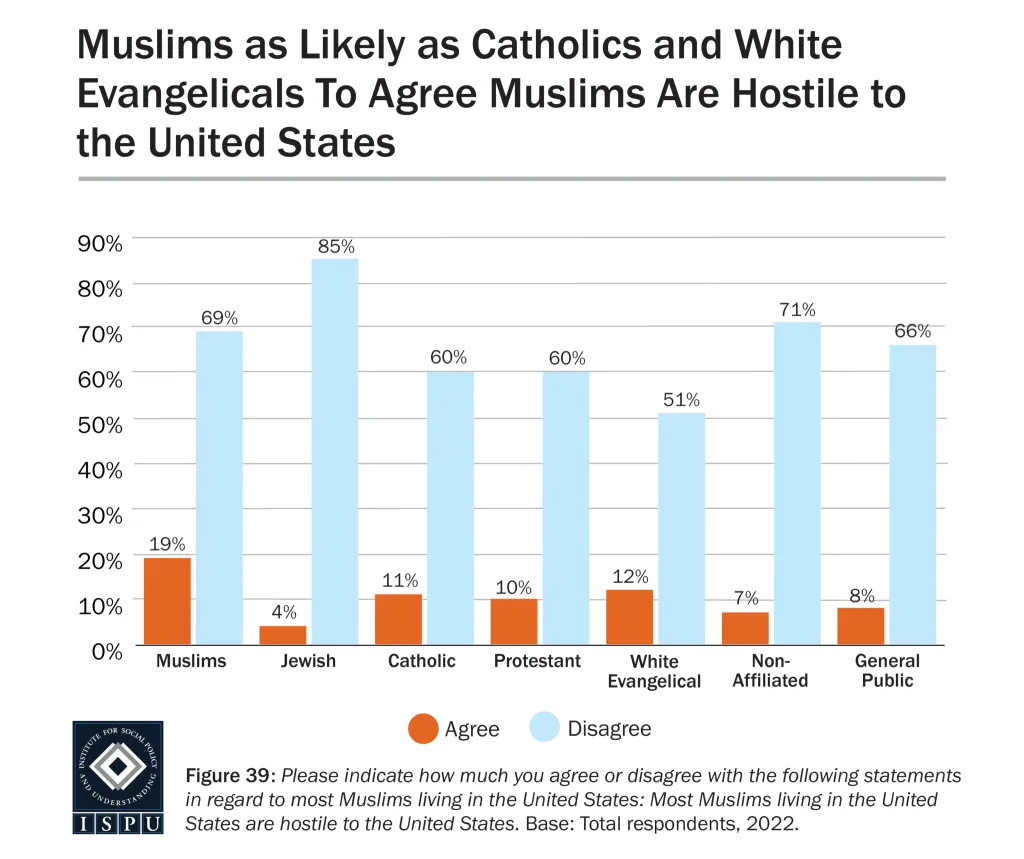
The third trope measured in the Islamophobia Index is that “most Muslims living in the US are hostile to the US.” We find that American Muslims (19%) are more likely to agree with this idea than are Jews (4%), Protestants (10%), the nonaffiliated (7%), and the general public (8%). At 11% and 12%, Catholics and white Evangelicals are as likely as Muslims to agree that Muslims are hostile to the United States. Among Muslims, men (23%) are more likely than women (14%) to endorse this trope.
A bar graph showing the proportion of all groups surveyed who agree or disagree with the false notion that most Muslims living in the US are hostile to the United States.
When looking at agreement with the false notion that “most Muslims in the United States are hostile to the US,” we find similar demographic patterns among Muslims as with the previously discussed tropes. Specifically, 30-49-year-olds (31%) were more likely than 18-29-year-olds (14%) and 50+-year-olds (7%) to agree that Muslims are hostile to the US. Additionally, white Muslims (31%) were more likely than Black (18%), Asian (6%), and Arab Muslims (12%), and Black Muslims were more likely than Asian Muslims. Finally, Muslims who were born into the faith were more likely than Muslims born outside of the faith to endorse the idea that Muslims are hostile to the US (21% vs. 9%, respectively).
Less Civilized
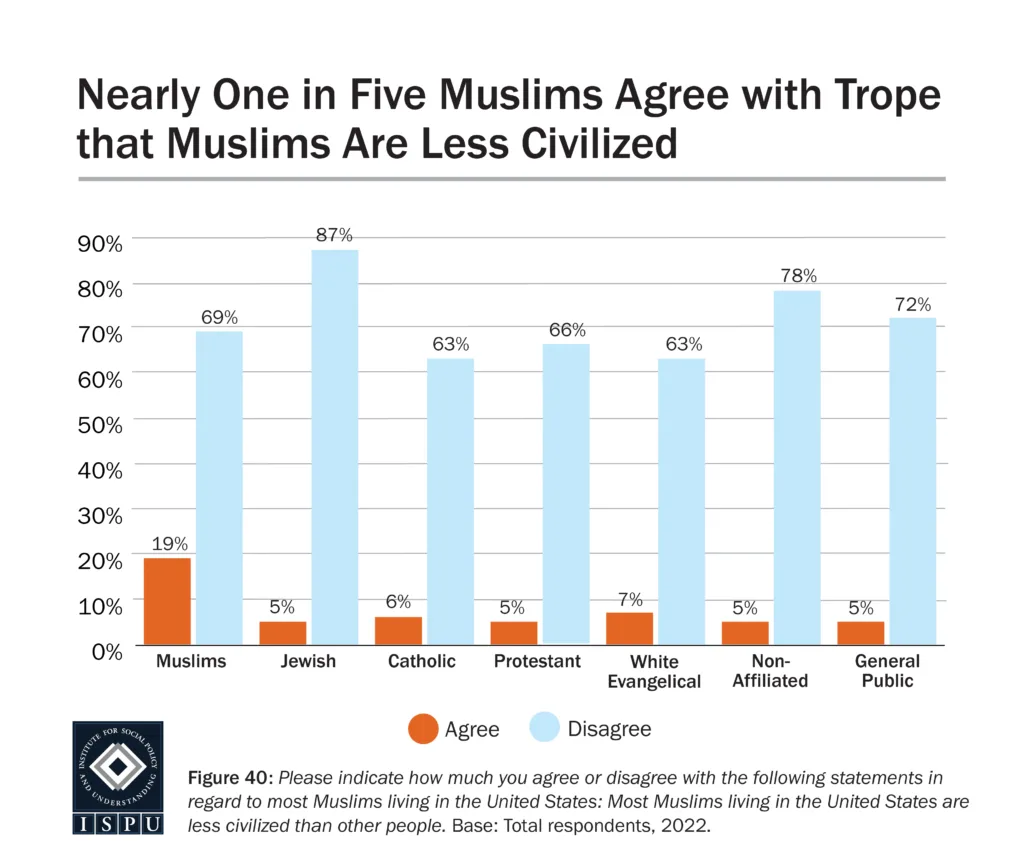
The fourth measure of Islamophobia is the level of agreement with the erroneous idea that most Muslims living in the United States are less civilized than other groups. Again, we find that Muslims exhibit higher levels of endorsement of this trope with American Muslims nearly three times more likely than white Evangelicals to do so. Nearly one in five Muslims (19%) agree with this trope, compared with 5% of Jews, 6% of Catholics, 5% of Protestants, 7% of white Evangelicals, 5% of the nonaffiliated, and 5% of the general public. The 19% of Muslims who agree with this idea includes 11% who ‘strongly agree’ compared with 1-2% of all other groups surveyed. The two groups most likely to disagree that Muslims are less civilized than others are Jews (87%) and the nonaffiliated (78%). In comparison, 69% of American Muslims disagree that Muslims living in the United States are less civilized than others.
A bar graph showing the proportion of all groups surveyed who agree or disagree with the false notion that most Muslims living in the US are less civilized than others.
Like the previous measure discussed (most Muslims more hostile to the US), Muslim men are more likely than women to endorse the idea that Muslims living in the US are less civilized than others (23% vs. 14%, respectively). Additionally, 29% of 30-49-year-old Muslims agree that Muslims in the United States are less civilized than other people, compared with 15% of 18-29-year-olds and 8% of 50+-year-olds. Like the previous measure, white Muslims are more likely than all other racial/ethnic groups to endorse the idea that most American Muslims are less civilized than others (34% vs. 12% of Black Muslims, 3% of Asian Muslims, and 2% of Arab Muslims). Finally, 22% of Muslims born into the faith agree with this trope, compared with 8% of Muslims born into another faith.
Collective Guilt
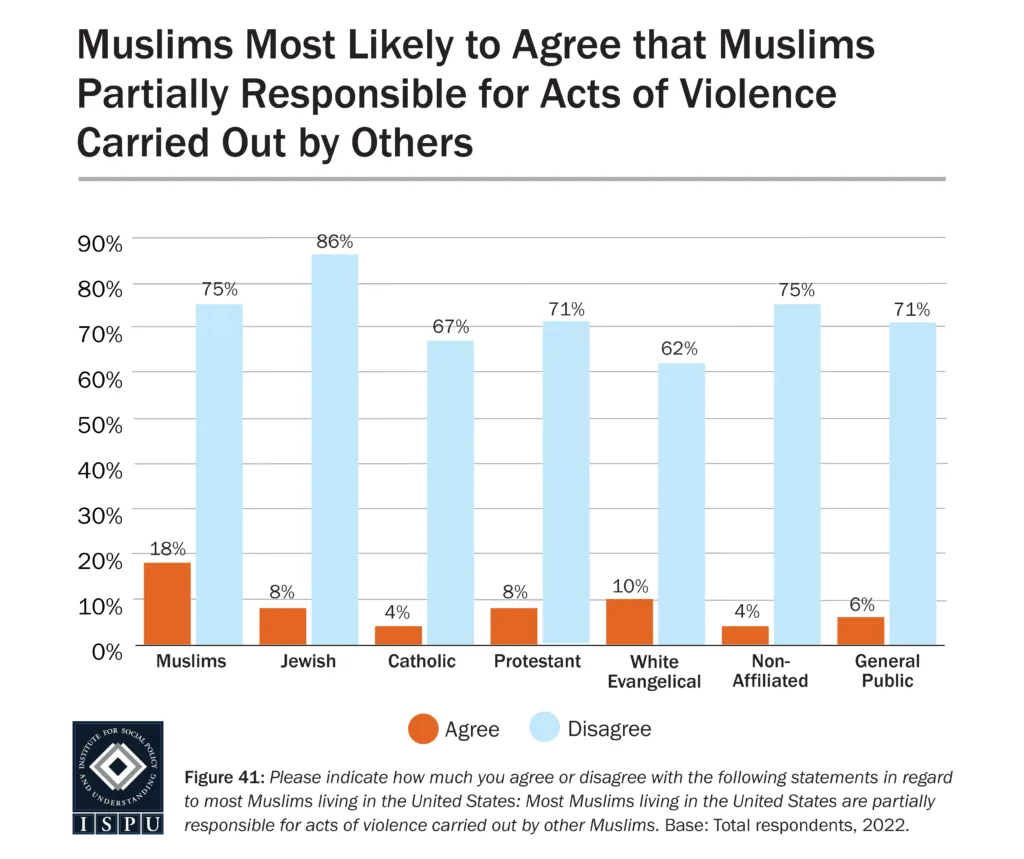
The fifth and final measure of Islamophobia measured in American Muslim Poll is collective blame (that most Muslims living in the US are partially responsible for acts of violence carried out by other Muslims). Again, we find Muslims are more likely than all other groups surveyed to agree with this trope (18% of Muslims vs. 8% of Jews, 4% of Catholics, 8% of Protestants, 10% of white Evangelicals, 4% of the nonaffiliated, and 6% of the general public). Among American Muslims, 12% ‘strongly agree’ that Muslims are partially to blame for acts of violence committed by other Muslims, compared to 1-2% of other groups.
A bar graph showing the proportion of all groups surveyed who agree or disagree with the false notion that most Muslims living in the US are partially responsible for acts of violence carried out by others.
Among Muslims, men and women are equally likely to endorse the collective guilt trope (20% of men and 15% of women). In terms of age and race, 30-49-year-olds (30%) and white Muslims (31%) are more likely than other age groups (11% of 18-29-year-olds and 9% of 50+-year-olds) and other racial groups (13% of Black Muslims and 7% of Asian and Arab Muslims). One in five Muslims who were born in the faith (21%) agree that most Muslims in the US are partially to blame for acts of violence committed by other Muslims, compared with 7% of Muslims born into another faith.
Making Sense of The Islamophobia Index Among Muslims
Endorsing negative stereotypes about one’s own community is referred to as internalized oppression, or internalized bigotry or racism in the case of a racial group. According to Dr. Muniba Saleem, an ISPU scholar and Associate Professor in Media Psychology, Intergroup Communication, and Diversity at the University of California, Santa Barbara:
There are well-documented studies showing that minorities can internalize the negative stereotypes of their group and that can influence their self-esteem, psychological distress, motivation, and performance (David et al., 2019; Siy & Cheryan, 2013; Steele et al., 2002). Other research has examined the negative consequences of media stereotypes on minorities’ self-esteem and experiences of shame and embarrassment (Ramasubramanian et al., 2017; Schmadet et al., 2015) as well as concerns of how the majority group will view them (Fujioka, 2005; Tsfati, 2007).
It is worth noting that internalized Islamophobia is more prevalent among younger Muslims than older members of the community, Americans who have lived the majority of their lives after 9/11/2001 in a country that has demonized their identity in popular culture, news media, political rhetoric, and in policy. Research suggests that this kind of steady drumbeat of bigoted ideas and state actions have a detrimental impact on the target group’s self-image and mental health.
Another noteworthy and alarming finding was the disproportionately negative views among white Muslims, who are also the most likely to report experiencing ‘regular’ religious discrimination. Some studies on internalized racism have surprisingly found that endorsing negative stereotypes about one’s own group is associated with a higher locus of control. This suggests that internalized prejudice may actually be a defense mechanism against the trauma of bigotry at the hands of the dominant group by agreeing with those in power but believing one has the choice (locus of control) to not be like those tropes. More research is needed to fully understand the why and how of internalized Islamophobia.
Discrimination and Bullying
Religious Discrimination Experienced by Muslims Remains Stable and High
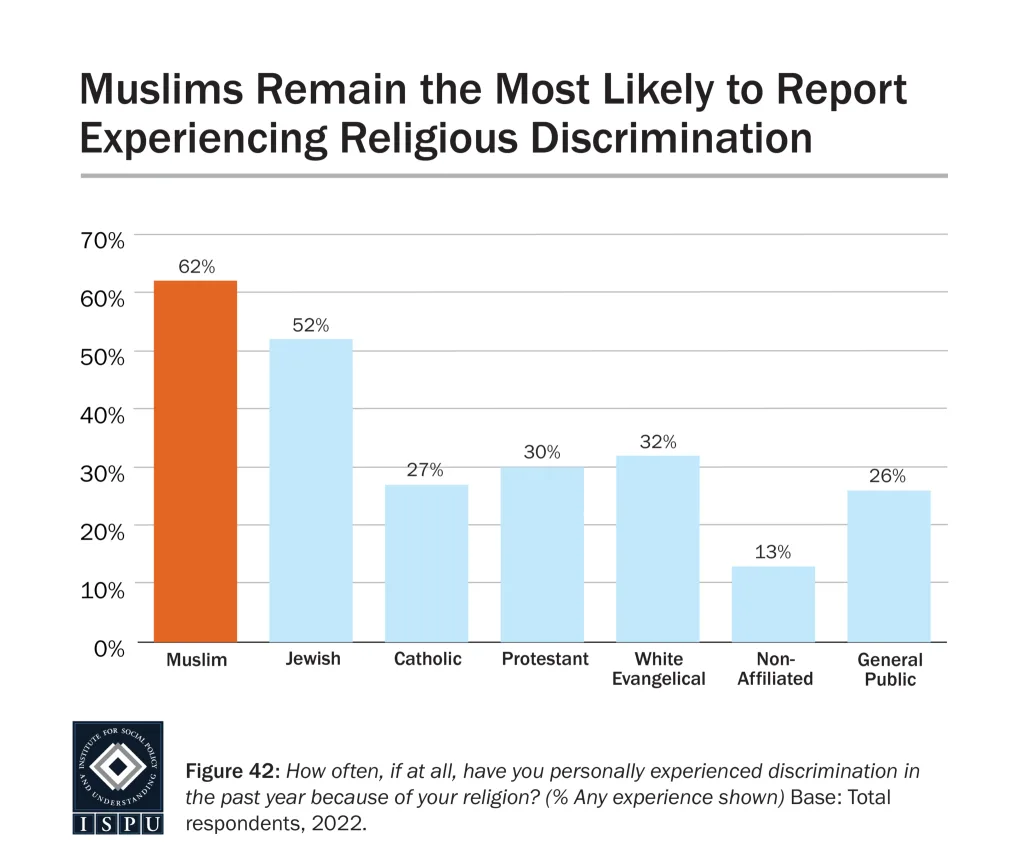
For the sixth year, we asked Americans how often they have faced religious discrimination over the past year. The percentage of people within surveyed groups who experience religious discrimination is steady year after year with no measured change after the new presidential administration. In 2022, Americans Muslims were the most likely group to report facing religious discrimination (62%). As found in previous years, Jewish Americans were the next most likely group to report experiencing religious discrimination (52%). In comparison, 27% of Catholics, 30% of Protestants, 32% of white Evangelicals, 13% of the nonaffiliated, and 26% of the general public reported facing discrimination because of their religion. Muslim men were as likely as Muslim women to experience religious-based discrimination (59% of men and 67% of women).
In 2022, Americans Muslims were the most likely group to report facing religious discrimination (62%).
A bar graph showing the proportion of all groups surveyed who report experiencing religious discrimination in the past year.A line graph showing the proportion of American Muslims who report experiencing religious discrimination in 2016 – 2022.
Older Muslims Least Likely to Report Experiencing Religious Discrimination, White Muslims Most Likely to Report “Regular” Discrimination
When examining levels of discrimination among American Muslims by age, we find Muslims aged 50+ years old are less likely than 18-29-year-olds and 30-49-year-olds to report experiencing religious discrimination (40% vs. 69% and 68%, respectively) but are still two times more likely than 50+-year-olds in the general public (20%). We also found racial/ethnic differences in experiences with religious discrimination among American Muslims. Seven in ten white Muslims (71%) report experiencing religious discrimination, which is more likely than 56% of Black Muslims who faced religious discrimination. Asian (60%) and Arab (58%) Muslims fell in-between in terms of having experienced religious discrimination. Notably, as found in American Muslim Poll 2020, white Muslims are most likely to report facing religious discrimination regularly. Nearly one-third of white Muslims (29%) reported facing religious discrimination on a regular basis, compared with 7% of Black Muslims, 12% of Asian Muslims, and 6% of Arab Muslims.
Muslims Much More Likely Than Others to Experience Religious Discrimination in Institutional Settings
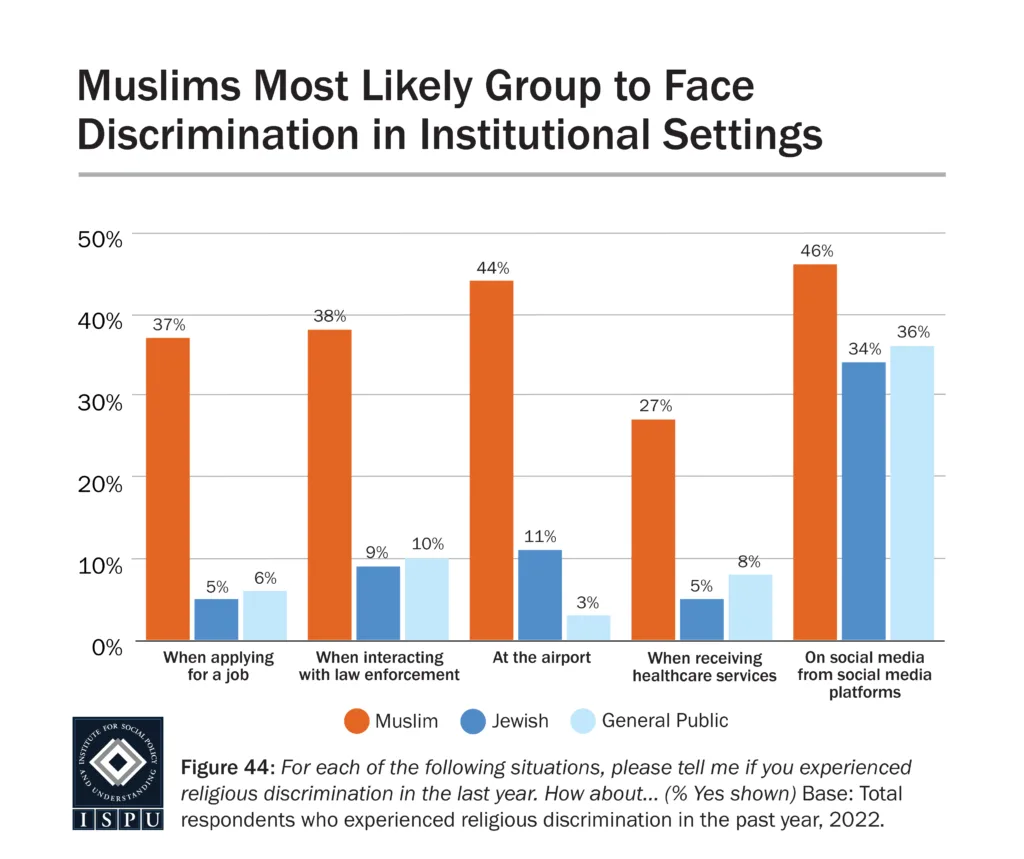
Among those who reporting facing any religious discrimination in the past year, we asked about whether it occurred in various settings. We find Muslims stand apart from all others in terms of not only the frequency, but how they experience religious discrimination. Particularly, Muslims who have experienced religious discrimination in the past year are more likely than Jews and general public who have faced religious discrimination to experience it in their interactions within institutional settings. Muslims are more likely than Jewish Americans and the general public to experience discrimination when applying for a job (37% vs. 5% and 6%, respectively) and when interacting with law enforcement (38% vs. 9% and 10%, respectively). In both situations, Muslim men are more likely than Muslim women to report facing discrimination (44% of men vs. 30% of women when applying for a job and 50% of men vs. 26% of women when interacting with law enforcement).
Other institutional settings where Muslims are much more likely than Jewish Americans and general public to face religious discrimination include at the airport (44% vs. 11% and 3%, respectively) and when seeking healthcare services (27% vs. 5% and 8%, respectively). In both settings, Muslim men and women were equally likely to face discrimination (48% and 39%, respectively, at the airport and 29% and 24%, respectively, in healthcare settings).
New in 2022, we also asked about experiences with religious discrimination on social media, both from other users and from the social media platforms themselves. Discrimination from social media platforms may manifest in several ways including having messages removed, accounts suspended or closed, or being completely kicked off a platform. We categorize religious discrimination on social media from social media platforms as institutional and find that nearly half (46%) of Muslims who have experienced any religious discrimination in the past year have had this experience, compared with 36% of the general public. One-third of Jews (34%) experienced religious discrimination on social media by the social media platform itself (as opposed to other users), on par with Muslims. Muslim men are uniquely more likely than their female co-religionists (53% vs. 39%, respectively) to report experiencing discrimination on these platforms. This gender difference may be due to the topics each chooses to engage in. Further research is needed to better understand this difference.
We categorize religious discrimination on social media from social media platforms as institutional and find that nearly half (46%) of Muslims who have experienced any religious discrimination in the past year have had this experience, compared with 36% of the general public.
A bar graph showing various instiutional settings where religious discrimination occurred among Muslims, Jews, and the general public who report facing religious discrimination in the past year.
Muslims More Likely to Experience Religious Discrimination in Individual Interactions
In 2022, we asked those who reported facing any religious discrimination in the past year about facing individual religious discrimination in two settings: when interacting with co-workers and on social media from other users. Among those who experienced religious discrimination in the past year, 43% of Muslims reported facing it from co-workers, more than 29% among Jewish Americans and 23% of the general public. Muslim men and women who have experienced religious discrimination in the past year are equally likely to experience it when interacting with co-workers (40% and 47%, respectively).
When it comes to facing religious discrimination on social media from other social media users, Muslims are more likely than the general public to do so (56% vs. 45%, respectively). Half of Jewish Americans who have faced any religious discrimination in the past year (51%) have experienced it on social media from other users, on par with American Muslims. Just as Muslim men were more likely than Muslim women to experience religious discrimination on social media from social media platforms, they were also more likely to face it from other social media users (63% vs. 49%).
A bar graph showing various personal settings where religious discrimination occurred among Muslims, Jews, and the general public who report facing religious discrimination in the past year.
As in Previous Years, Muslim Families by Far the Most Likely to Have a Child Who Has Been Bullied for Their Religion
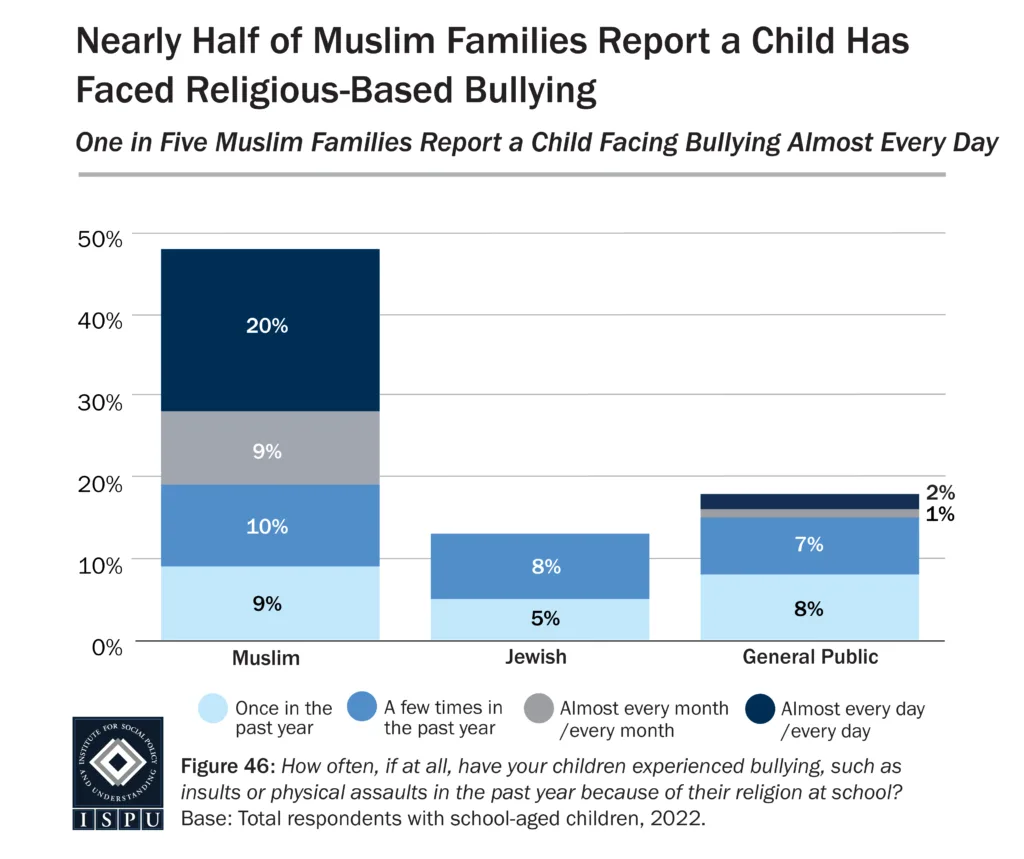
As we’ve seen in the past, Muslim adults are not the only ones impacted by Islamophobia and anti-Muslim bigotry. Four in ten Muslims (40%) report having school-age children. Among those, we asked if a child has ever experienced religious-based bullying in the past year. At 48%, Muslim families are by far the most likely to report having a child who faced religious-based bullying in the past year. In comparison, 13% of Jewish families and 18% of families in the general public reported having a child who was bullied for their religion. Even more alarming is that 20% of Muslim families report that the bullying happens nearly every day.
At 48%, Muslim families are by far the most likely to report having a child who faced religious-based bullying in the past year.
A stacked bar graph showing the proportion and frequency of Muslim families with a child who faced religious-based bullyin in the past year.
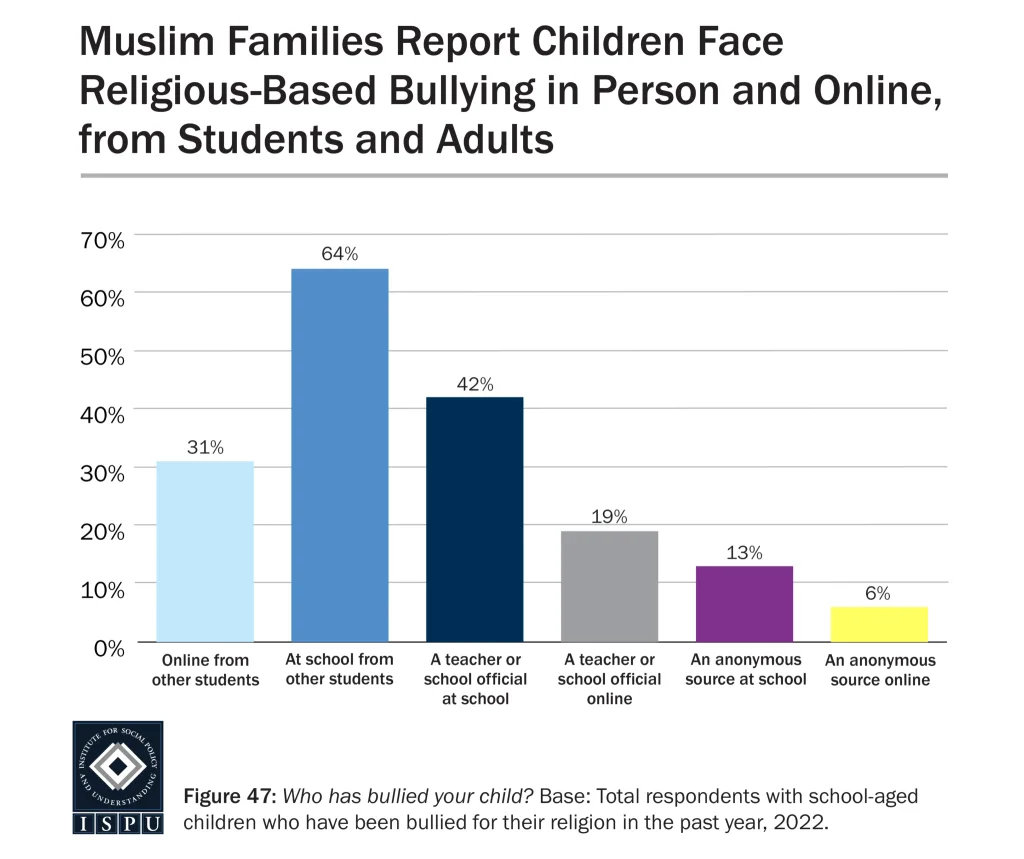
Finally, among those who reported a child has faced religious-based bullying, we then asked about who bullied the child. New in 2022, we include online sources of bullying as a response option. This was especially important after American children spent nearly two years of their lives online due to pandemic-related closures. We find that roughly a third of Muslim families report religious-based bullying online by other students (31%), while 64% report bullying occurred at school from other students. As we’ve found previously, peers are not the only bullies children face. Four in ten Muslim families who’ve experienced bullying (42%) say the bully was a teacher or school official at school and roughly one in five say the bully was a teacher or school official online (19%). These findings shed light on cyberbullying as a major issue Muslim families face. In sum, Muslim children and parents have to worry about facing religious-based bullying at school and online from other students and even trusted adults in the school.
A bar graph showing the sources of religious-based bullying faced by children in Muslim families.
ISPU’s survey of American Muslims, Jews, Catholics, Protestants, and the non-affiliated is one of a kind, offering the latest trends and demographic data on American Muslims. And every year, we rely on individuals like you to keep this research free and accessible to all. Right now, we need your help to keep it that way, so that millions can remain informed on the topics that matter the most. If you value the reliable data our poll provides, consider making a donation—big or small—in support of ISPU’s American Muslim Poll. It only takes a minute. Thank you.
The year 2022 marks the fourth time over the past five years the Islamophobia Index was measured in the American Muslim Poll (beginning in 2017). The Islamophobia Index is a measure of the level of public endorsement of five false, negative stereotypes associated with Muslims in America. These are the items used to construct the index:
Please indicate how much you agree or disagree with the following statements, where 1 means you strongly disagree and 5 means you strongly agree in regard to most Muslims living in the United States.
Most Muslims living in the United States are more prone to violence than other people.
Most Muslims living in the United States discriminate against women.
Most Muslims living in the United States are hostile to the United States.
Most Muslims living in the United States are less civilized than other people.
Most Muslims living in the United States are partially responsible for acts of violence carried out by other Muslims.
ISPU analysts chose these five variables based on previous research [2] linking these perceptions with greater tolerance for anti-Muslim policies such as mosque surveillance, racial profiling, and greater scrutiny of Muslims at airports, the so-called Muslim Ban, and even taking away voting rights from Americans who are Muslims. These five measures are not meant to cover the totality of public Islamophobia, which can and does include many other false beliefs about Muslims. They are instead meant to offer an evidence-based measure of five perceptions known to be linked to acceptance of discriminatory policies.
Answers to this battery of questions were used to construct an additive scale that measures overall anti-Muslim sentiment. [3] The resulting Islamophobia Index provides a single metric that is easy to understand, compare, and track over time. The Islamophobia Index measures the endorsement of anti-Muslim stereotypes (violent, misogynist), perceptions of Muslim aggression toward the United States, degree of Muslim dehumanization (less civilized), and perceptions of Muslim collective blame (partially responsible for violence), all of which have been shown to predict public support for discriminatory policies toward Muslims. [4]
It is noteworthy that this index, while called simply the “Islamophobia Index,” only measures anti-Muslim sentiment among the public and not the degree to which Islamophobia is institutionalized by the state. Islamophobia is not simply a phenomenon of societal sentiment, but is a structural phenomenon, manifesting in legislation, budget decisions, and law enforcement practices at the local, state, and federal levels. While our index does not measure structural Islamophobia, public tolerance for many of these practices is linked to higher scores on the Islamophobia Index. [5]
Islamophobia is not simply a phenomenon of societal sentiment, but is a structural phenomenon, manifesting in legislation, budget decisions, and law enforcement practices at the local, state, and federal levels.
Muslims Climb in Islamophobic Beliefs as Other Groups Drop
In 2022, the general public scored 25 on the Islamophobia Index (on a scale of 0-100), compared to 27 in 2020. With an Islamophobia Index score of 17, Jewish Americans were the lowest among all faith groups, including Muslims who scored 26. Protestants (23) and the nonaffiliated (22) scored similarly, while Catholics (28) and white Evangelicals (30) were highest.
In 2020, we noted a significant decline in Islamophobia among Jewish Americans since 2018. In 2022, we find Islamophobia is on the decline among other groups, but not among Muslims. Protestants have declined from a score of 26 in 2018 to 23 in 2022 and white Evangelicals from a score of 40 in 2018 to 30 in 2022. While the general public had a lower score in 2022 (25) compared with 2019 (28), scores have remained relatively stable since 2018 (24). Catholics have increased from a score of 22 in 2018 to 28 in 2022 but remained stable since 2020 when they scored 29.
For Muslims, scores on the Islamophobia Index have increased from 18 in 2018 to 26 in 2022. Between 2020 and 2022, the score increased six points from 20 to 26. Further analysis reveals that higher Islamophobia Index scores among Muslims are driven primarily by Muslims who identify as white.
For Muslims, scores on the Islamophobia Index have increased from 18 in 2018 to 26 in 2022.
A line graph showing scores on the Islamophobia Index from 2018 – 2022 for each group surveyed.
Looking at Islamophobia Index scores by race/ethnicity, we find the largest increase among white Muslims. In 2018, white Muslims scored 21 and remained stable in 2019 (20). In 2020, white Muslims showed increased Islamophobia with a score of 27, followed by an even larger increase in 2022 with a score of 40. Further research is needed to explain why there has been such a large increase in Islamophobia among white Muslims. Among Black, Asian, and Arab Muslims, Islamophobia Index scores remained stable between 2018 and 2022. Similarly, among the general public, Islamophobia Index score remained stable between 2018 and 2022 among white, Black, and Hispanic Americans.
A line graph showing scores on the Islamophobia Index for Muslim racial/ethnic groups from 2018 – 2022.A line graph showing scores on the Islamophobia Index among racial groups in the general public between 2018 – 2022.
Tropes Measured in the Islamophobia Index
Violence
The majority of Muslims disagree with the notion that Muslims are more prone to violence than other people (64%). However, Muslims, themselves, are by far the most Islamophobic group when it comes to the false notion that Muslims are more prone to violence than others. One-quarter of American Muslims (24%) somewhat or strongly agree with this trope, which is at least about two times more likely than other groups. In comparison, 9% of Jews, 8% of Catholics, 11% of Protestants, 12% of white Evangelicals, 13% of the nonaffiliated, and 9% of the general public agree with the idea that Muslims are more prone to violence than others. Self-identified white Muslims (35%) are more likely to agree compared with Black (18%) and Asian Muslims (16%). Roughly one-quarter of Arab Muslims (23%) agree that Muslims are more prone to violence than others.
A bar graph showing the proportion of all groups surveyed who agree or disagree with the false notion that most Muslims living in the US are more prone to violence than others.
Looking by age, we find that younger Muslims are particularly more likely than the oldest Muslims to agree with this trope. One-quarter of 18-29-year-olds (24%) and a third of 30-49-year-olds (33%) express agreement, compared with just 9% of 50+-year-old Muslims. This finding is especially noteworthy since younger Muslims formed their identity and self-perception in the past twenty years, a time when their community was a target of law enforcement and politicians.
Comparing respondents who were born into Islam with Muslims who were not born into the faith, converts were far less likely to endorse this stereotype. More than one-quarter of born Muslims (27%) report agreement compared with 11% of Muslims not born in the faith. These findings suggest the internalized Islamophobia that has possibly resulted, in part, from two decades of collective blame since the 9/11 attacks.
Misogyny
Unlike the level of agreement with the stereotype that Muslims are violent, at 69% Muslims are among the most likely to disagree with the trope of misogyny (that ‘most Muslims living in the United States discriminate against women’). In comparison, 57% of Jews, 41% of Catholics, 39% of Protestants, 31% of white Evangelicals, 50% of the nonaffiliated, and 45% of the general public disagree with this stereotype. When it comes to agreement with the idea that Muslims are inherently misogynistic, white Evangelicals are most likely to agree (32%). Roughly one in five Muslims (21%) agree with this trope, which is on par with 20% of Jews, 21% of Catholics, 24% of Protestants, 18% of the nonaffiliated, and 20% of the general public. Among Muslims, men and women express similar levels of agreement with the ideas that Muslims discriminate against women.
A bar graph showing the proportion of all groups surveyed who disagree with the false notion that most Muslims living in the US discriminate against women.
Looking by age, we find that 31% of Muslims aged 30-49 agree that Muslims in America discriminate against women, compared with 14% of 18-29-year-olds and 13% of 50+-year-olds (13%). Among the general public, the youngest (aged 18-29) are less likely than older individuals (30-49-year-olds and 50+-year-olds) to agree with the trope that Muslims are misogynistic (8% vs. 21% and 24%, respectively).
Analysis by race reveals that white Muslims (34%) are more likely than Black (19%), Asian (10%), and Arab Muslims (10%) to express agreement with the notion that Muslims discriminate against women. Black, white, and Asian Muslims are on par in their level of agreement. Racial/ethnic groups among the general public are also equally likely to agree that Muslims discriminate against women (15% of Black and Hispanic Americans and 23% of whites). As was found for the trope that Muslims are more prone to violence than other groups, Muslims born into the faith are more likely than those not born into the faith to agree that Muslims are misogynistic (23% vs. 10%, respectively).
Hostile to the United States
The third trope measured in the Islamophobia Index is that “most Muslims living in the US are hostile to the US.” We find that American Muslims (19%) are more likely to agree with this idea than are Jews (4%), Protestants (10%), the nonaffiliated (7%), and the general public (8%). At 11% and 12%, Catholics and white Evangelicals are as likely as Muslims to agree that Muslims are hostile to the United States. Among Muslims, men (23%) are more likely than women (14%) to endorse this trope.
A bar graph showing the proportion of all groups surveyed who agree or disagree with the false notion that most Muslims living in the US are hostile to the United States.
When looking at agreement with the false notion that “most Muslims in the United States are hostile to the US,” we find similar demographic patterns among Muslims as with the previously discussed tropes. Specifically, 30-49-year-olds (31%) were more likely than 18-29-year-olds (14%) and 50+-year-olds (7%) to agree that Muslims are hostile to the US. Additionally, white Muslims (31%) were more likely than Black (18%), Asian (6%), and Arab Muslims (12%), and Black Muslims were more likely than Asian Muslims. Finally, Muslims who were born into the faith were more likely than Muslims born outside of the faith to endorse the idea that Muslims are hostile to the US (21% vs. 9%, respectively).
Less Civilized
The fourth measure of Islamophobia is the level of agreement with the erroneous idea that most Muslims living in the United States are less civilized than other groups. Again, we find that Muslims exhibit higher levels of endorsement of this trope with American Muslims nearly three times more likely than white Evangelicals to do so. Nearly one in five Muslims (19%) agree with this trope, compared with 5% of Jews, 6% of Catholics, 5% of Protestants, 7% of white Evangelicals, 5% of the nonaffiliated, and 5% of the general public. The 19% of Muslims who agree with this idea includes 11% who ‘strongly agree’ compared with 1-2% of all other groups surveyed. The two groups most likely to disagree that Muslims are less civilized than others are Jews (87%) and the nonaffiliated (78%). In comparison, 69% of American Muslims disagree that Muslims living in the United States are less civilized than others.
A bar graph showing the proportion of all groups surveyed who agree or disagree with the false notion that most Muslims living in the US are less civilized than others.
Like the previous measure discussed (most Muslims more hostile to the US), Muslim men are more likely than women to endorse the idea that Muslims living in the US are less civilized than others (23% vs. 14%, respectively). Additionally, 29% of 30-49-year-old Muslims agree that Muslims in the United States are less civilized than other people, compared with 15% of 18-29-year-olds and 8% of 50+-year-olds. Like the previous measure, white Muslims are more likely than all other racial/ethnic groups to endorse the idea that most American Muslims are less civilized than others (34% vs. 12% of Black Muslims, 3% of Asian Muslims, and 2% of Arab Muslims). Finally, 22% of Muslims born into the faith agree with this trope, compared with 8% of Muslims born into another faith.
Collective Guilt
The fifth and final measure of Islamophobia measured in American Muslim Poll is collective blame (that most Muslims living in the US are partially responsible for acts of violence carried out by other Muslims). Again, we find Muslims are more likely than all other groups surveyed to agree with this trope (18% of Muslims vs. 8% of Jews, 4% of Catholics, 8% of Protestants, 10% of white Evangelicals, 4% of the nonaffiliated, and 6% of the general public). Among American Muslims, 12% ‘strongly agree’ that Muslims are partially to blame for acts of violence committed by other Muslims, compared to 1-2% of other groups.
A bar graph showing the proportion of all groups surveyed who agree or disagree with the false notion that most Muslims living in the US are partially responsible for acts of violence carried out by others.
Among Muslims, men and women are equally likely to endorse the collective guilt trope (20% of men and 15% of women). In terms of age and race, 30-49-year-olds (30%) and white Muslims (31%) are more likely than other age groups (11% of 18-29-year-olds and 9% of 50+-year-olds) and other racial groups (13% of Black Muslims and 7% of Asian and Arab Muslims). One in five Muslims who were born in the faith (21%) agree that most Muslims in the US are partially to blame for acts of violence committed by other Muslims, compared with 7% of Muslims born into another faith.
Making Sense of The Islamophobia Index Among Muslims
Endorsing negative stereotypes about one’s own community is referred to as internalized oppression, or internalized bigotry or racism in the case of a racial group. According to Dr. Muniba Saleem, an ISPU scholar and Associate Professor in Media Psychology, Intergroup Communication, and Diversity at the University of California, Santa Barbara:
There are well-documented studies showing that minorities can internalize the negative stereotypes of their group and that can influence their self-esteem, psychological distress, motivation, and performance (David et al., 2019; Siy & Cheryan, 2013; Steele et al., 2002). Other research has examined the negative consequences of media stereotypes on minorities’ self-esteem and experiences of shame and embarrassment (Ramasubramanian et al., 2017; Schmadet et al., 2015) as well as concerns of how the majority group will view them (Fujioka, 2005; Tsfati, 2007).
It is worth noting that internalized Islamophobia is more prevalent among younger Muslims than older members of the community, Americans who have lived the majority of their lives after 9/11/2001 in a country that has demonized their identity in popular culture, news media, political rhetoric, and in policy. Research suggests that this kind of steady drumbeat of bigoted ideas and state actions have a detrimental impact on the target group’s self-image and mental health.
Another noteworthy and alarming finding was the disproportionately negative views among white Muslims, who are also the most likely to report experiencing ‘regular’ religious discrimination. Some studies on internalized racism have surprisingly found that endorsing negative stereotypes about one’s own group is associated with a higher locus of control. This suggests that internalized prejudice may actually be a defense mechanism against the trauma of bigotry at the hands of the dominant group by agreeing with those in power but believing one has the choice (locus of control) to not be like those tropes. More research is needed to fully understand the why and how of internalized Islamophobia.
Discrimination and Bullying
Religious Discrimination Experienced by Muslims Remains Stable and High
For the sixth year, we asked Americans how often they have faced religious discrimination over the past year. The percentage of people within surveyed groups who experience religious discrimination is steady year after year with no measured change after the new presidential administration. In 2022, Americans Muslims were the most likely group to report facing religious discrimination (62%). As found in previous years, Jewish Americans were the next most likely group to report experiencing religious discrimination (52%). In comparison, 27% of Catholics, 30% of Protestants, 32% of white Evangelicals, 13% of the nonaffiliated, and 26% of the general public reported facing discrimination because of their religion. Muslim men were as likely as Muslim women to experience religious-based discrimination (59% of men and 67% of women).
In 2022, Americans Muslims were the most likely group to report facing religious discrimination (62%).
A bar graph showing the proportion of all groups surveyed who report experiencing religious discrimination in the past year.A line graph showing the proportion of American Muslims who report experiencing religious discrimination in 2016 – 2022.
Older Muslims Least Likely to Report Experiencing Religious Discrimination, White Muslims Most Likely to Report “Regular” Discrimination
When examining levels of discrimination among American Muslims by age, we find Muslims aged 50+ years old are less likely than 18-29-year-olds and 30-49-year-olds to report experiencing religious discrimination (40% vs. 69% and 68%, respectively) but are still two times more likely than 50+-year-olds in the general public (20%). We also found racial/ethnic differences in experiences with religious discrimination among American Muslims. Seven in ten white Muslims (71%) report experiencing religious discrimination, which is more likely than 56% of Black Muslims who faced religious discrimination. Asian (60%) and Arab (58%) Muslims fell in-between in terms of having experienced religious discrimination. Notably, as found in American Muslim Poll 2020, white Muslims are most likely to report facing religious discrimination regularly. Nearly one-third of white Muslims (29%) reported facing religious discrimination on a regular basis, compared with 7% of Black Muslims, 12% of Asian Muslims, and 6% of Arab Muslims.
Muslims Much More Likely Than Others to Experience Religious Discrimination in Institutional Settings
Among those who reporting facing any religious discrimination in the past year, we asked about whether it occurred in various settings. We find Muslims stand apart from all others in terms of not only the frequency, but how they experience religious discrimination. Particularly, Muslims who have experienced religious discrimination in the past year are more likely than Jews and general public who have faced religious discrimination to experience it in their interactions within institutional settings. Muslims are more likely than Jewish Americans and the general public to experience discrimination when applying for a job (37% vs. 5% and 6%, respectively) and when interacting with law enforcement (38% vs. 9% and 10%, respectively). In both situations, Muslim men are more likely than Muslim women to report facing discrimination (44% of men vs. 30% of women when applying for a job and 50% of men vs. 26% of women when interacting with law enforcement).
Other institutional settings where Muslims are much more likely than Jewish Americans and general public to face religious discrimination include at the airport (44% vs. 11% and 3%, respectively) and when seeking healthcare services (27% vs. 5% and 8%, respectively). In both settings, Muslim men and women were equally likely to face discrimination (48% and 39%, respectively, at the airport and 29% and 24%, respectively, in healthcare settings).
New in 2022, we also asked about experiences with religious discrimination on social media, both from other users and from the social media platforms themselves. Discrimination from social media platforms may manifest in several ways including having messages removed, accounts suspended or closed, or being completely kicked off a platform. We categorize religious discrimination on social media from social media platforms as institutional and find that nearly half (46%) of Muslims who have experienced any religious discrimination in the past year have had this experience, compared with 36% of the general public. One-third of Jews (34%) experienced religious discrimination on social media by the social media platform itself (as opposed to other users), on par with Muslims. Muslim men are uniquely more likely than their female co-religionists (53% vs. 39%, respectively) to report experiencing discrimination on these platforms. This gender difference may be due to the topics each chooses to engage in. Further research is needed to better understand this difference.
We categorize religious discrimination on social media from social media platforms as institutional and find that nearly half (46%) of Muslims who have experienced any religious discrimination in the past year have had this experience, compared with 36% of the general public.
A bar graph showing various instiutional settings where religious discrimination occurred among Muslims, Jews, and the general public who report facing religious discrimination in the past year.
Muslims More Likely to Experience Religious Discrimination in Individual Interactions
In 2022, we asked those who reported facing any religious discrimination in the past year about facing individual religious discrimination in two settings: when interacting with co-workers and on social media from other users. Among those who experienced religious discrimination in the past year, 43% of Muslims reported facing it from co-workers, more than 29% among Jewish Americans and 23% of the general public. Muslim men and women who have experienced religious discrimination in the past year are equally likely to experience it when interacting with co-workers (40% and 47%, respectively).
When it comes to facing religious discrimination on social media from other social media users, Muslims are more likely than the general public to do so (56% vs. 45%, respectively). Half of Jewish Americans who have faced any religious discrimination in the past year (51%) have experienced it on social media from other users, on par with American Muslims. Just as Muslim men were more likely than Muslim women to experience religious discrimination on social media from social media platforms, they were also more likely to face it from other social media users (63% vs. 49%).
A bar graph showing various personal settings where religious discrimination occurred among Muslims, Jews, and the general public who report facing religious discrimination in the past year.
As in Previous Years, Muslim Families by Far the Most Likely to Have a Child Who Has Been Bullied for Their Religion
As we’ve seen in the past, Muslim adults are not the only ones impacted by Islamophobia and anti-Muslim bigotry. Four in ten Muslims (40%) report having school-age children. Among those, we asked if a child has ever experienced religious-based bullying in the past year. At 48%, Muslim families are by far the most likely to report having a child who faced religious-based bullying in the past year. In comparison, 13% of Jewish families and 18% of families in the general public reported having a child who was bullied for their religion. Even more alarming is that 20% of Muslim families report that the bullying happens nearly every day.
At 48%, Muslim families are by far the most likely to report having a child who faced religious-based bullying in the past year.
A stacked bar graph showing the proportion and frequency of Muslim families with a child who faced religious-based bullyin in the past year.
Finally, among those who reported a child has faced religious-based bullying, we then asked about who bullied the child. New in 2022, we include online sources of bullying as a response option. This was especially important after American children spent nearly two years of their lives online due to pandemic-related closures. We find that roughly a third of Muslim families report religious-based bullying online by other students (31%), while 64% report bullying occurred at school from other students. As we’ve found previously, peers are not the only bullies children face. Four in ten Muslim families who’ve experienced bullying (42%) say the bully was a teacher or school official at school and roughly one in five say the bully was a teacher or school official online (19%). These findings shed light on cyberbullying as a major issue Muslim families face. In sum, Muslim children and parents have to worry about facing religious-based bullying at school and online from other students and even trusted adults in the school.
A bar graph showing the sources of religious-based bullying faced by children in Muslim families.
ISPU’s survey of American Muslims, Jews, Catholics, Protestants, and the non-affiliated is one of a kind, offering the latest trends and demographic data on American Muslims. And every year, we rely on individuals like you to keep this research free and accessible to all. Right now, we need your help to keep it that way, so that millions can remain informed on the topics that matter the most. If you value the reliable data our poll provides, consider making a donation—big or small—in support of ISPU’s American Muslim Poll. It only takes a minute. Thank you.