.
American Muslim Poll 2022:
A Politics and Pandemic Status Report
AUGUST 25, 2022 | BY DALIA MOGAHED, ERUM IKRAMULLAH, AND YOUSSEF CHOUHOUD
.
PART I: Who Are American Muslims Now?
We last fielded the American Muslim Poll from mid-March to mid-April 2020, just as the COVID-19 pandemic started and the country went into lockdown. The current poll, fielded mid-February to mid-March 2022, provides a snapshot of the American Muslim community, as well as other faith and non-faith communities, two years later. This study captured perspectives in an election year, as our nation entered a new stage of living with the continually evolving virus, grappled with economic concerns, racial inequity, continued gun violence, and a deepening partisan divide.
To better understand the impact of the pandemic on Muslim communities, as well as the broader public in the US, ISPU fielded a survey in March 2021 as part of our Community in the Time of Corona study. We found that, compared to the general public, COVID has had a disproportionately negative impact on American Muslims economically and psychologically. It is in this context that we present the current demographics of the American Muslim community.

DOWNLOADS
.
Demographics and Life Situation
American Muslims Are More Likely to be Young and Poor
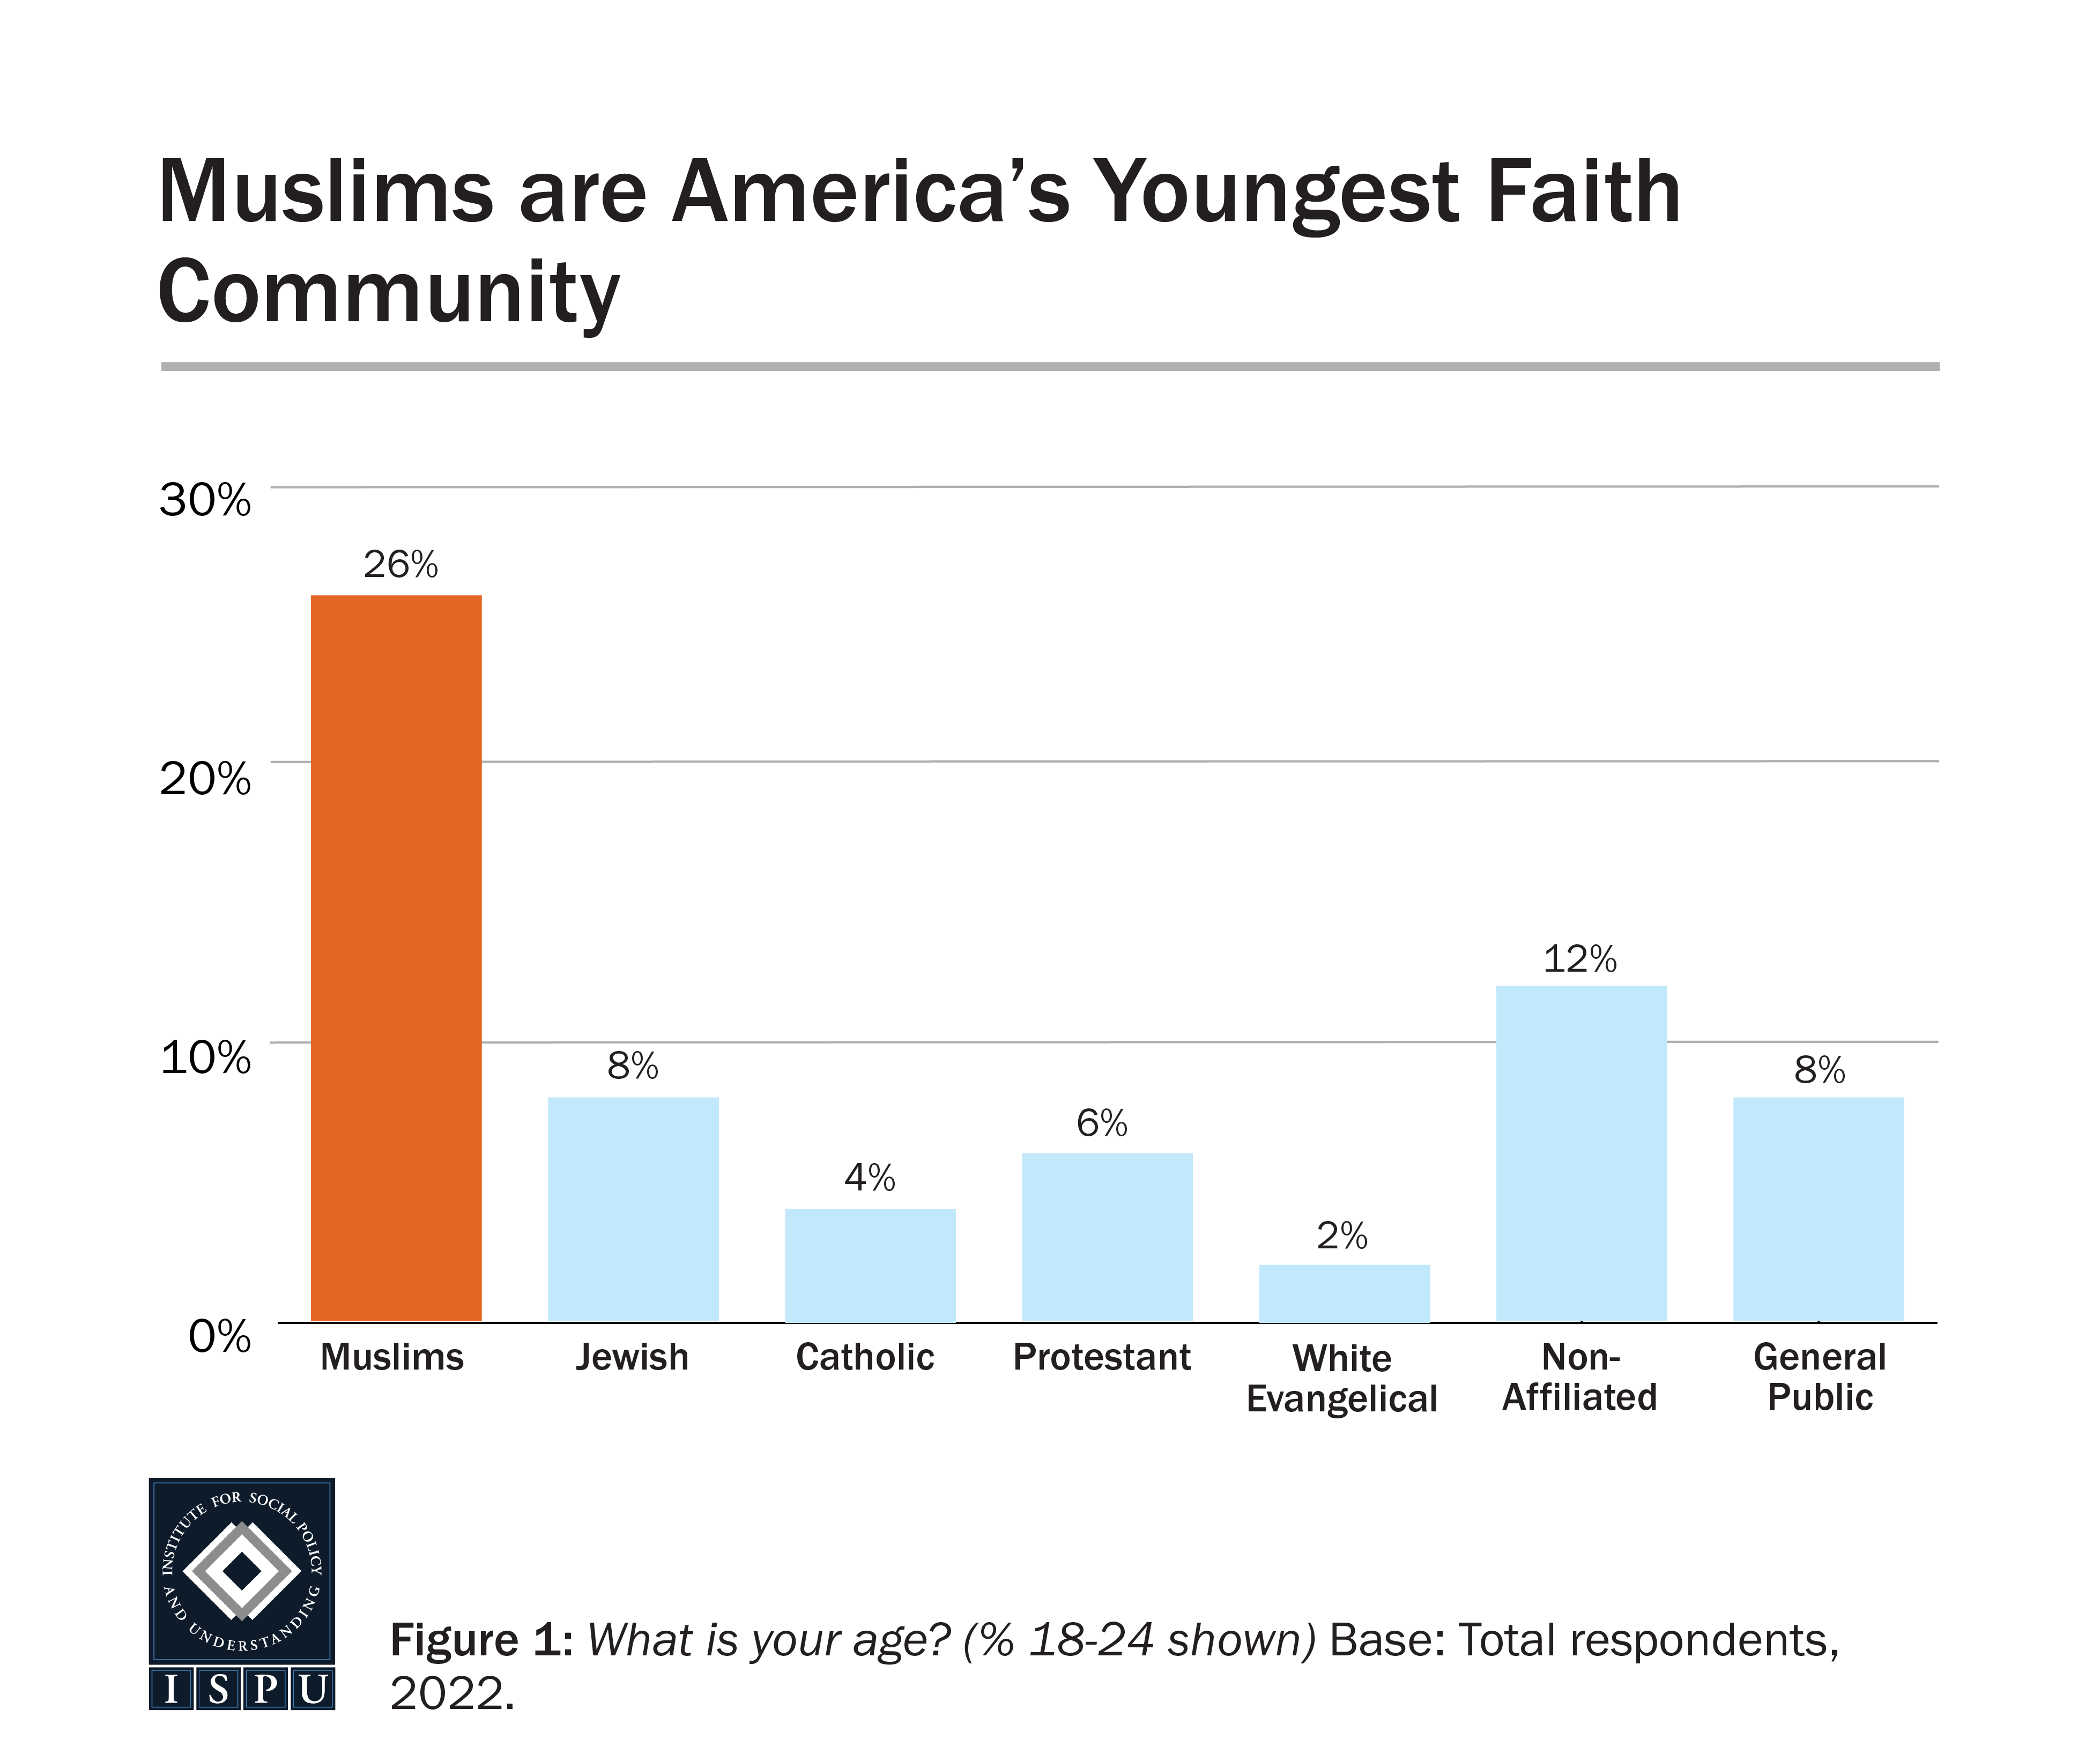
As reported in 2017, American Muslims are younger than all other faith and non-faith groups. One-quarter of American Muslims (26%) are between the ages of 18 and 24, compared with 2%-12% of other groups surveyed. On the other end of the spectrum, just 7% of American Muslims and 9% of the nonaffiliated are aged 65+ years old, compared with 29% of Jews, 24% of Catholics, 36% of Protestants, 39% of white Evangelicals, and 22% of the general public.
Did You Know?
ISPU’s survey of American Muslims, Jews, Catholics, Protestants, and the non-affiliated is one of a kind, offering the latest trends and demographic data on American Muslims. And every year, we rely on individuals like you to keep this research free and accessible to all. Right now, we need your help to keep it that way, so that millions can remain informed on the topics that matter the most. If you value the reliable data our poll provides, consider making a donation—big or small—in support of ISPU’s American Muslim Poll. It only takes a minute. Thank you.
This age difference has wide-ranging implications. American Muslims are more likely to contribute to the labor force and pay taxes. It also means, by virtue of a larger share of the population being of child-bearing age, the community is likely to grow faster than groups with an older average age where fewer people are having children. In the case of American Muslims, it also means that a significant segment of the group has never known an America before 9/11, and have come of age in a world where their faith community is often targeted by political figures and law enforcement.
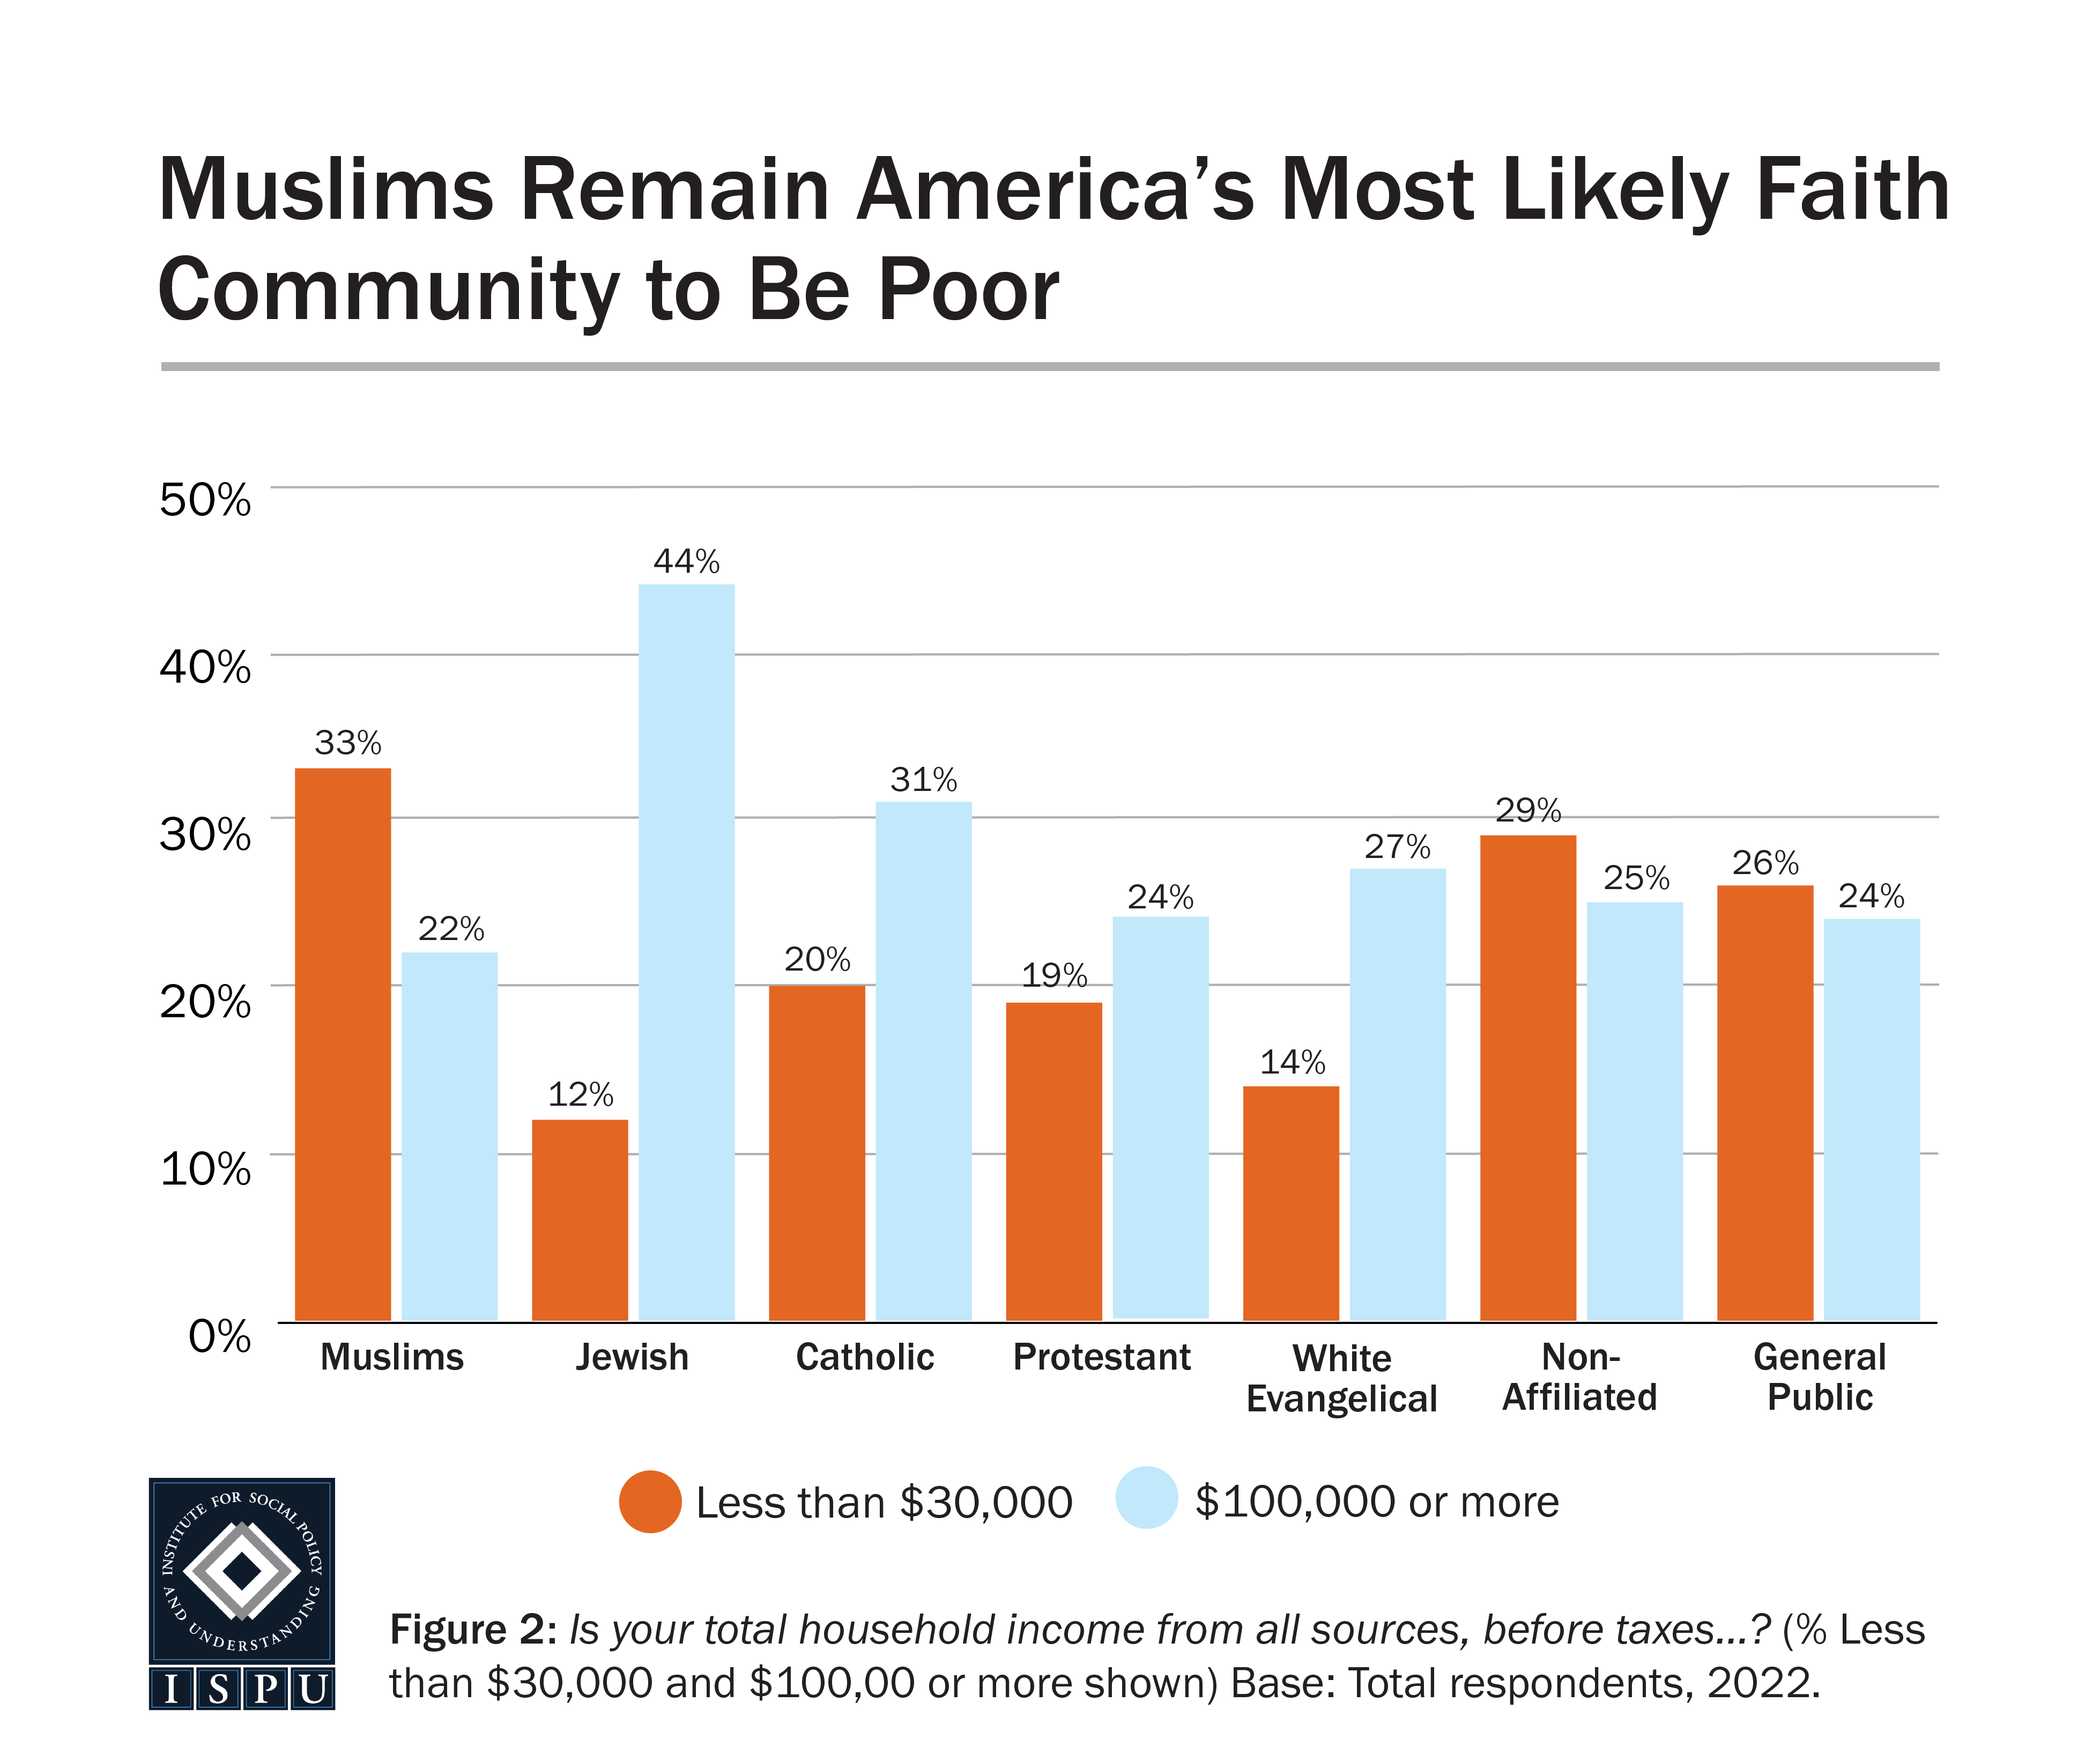
When looking at income, we find American Muslims continue to be the most likely faith community to be poor (as previously found in 2017). Specifically, one-third of American Muslims (33%) have a household income lower than $30,000, compared with 12% of Jews, 20% of Catholics, 19% of Protestants, 14% of white Evangelicals, and 26% of the general public. Americans who are not affiliated with a faith community are on par with Muslims, with 29% having a household income less than $30,000.
On the other end of the income spectrum, about one-fifth of American Muslims (22%) earn $100,000 or more, on par with all other groups except Jews. Nearly half of Jewish Americans (44%) earn $100,000 or more, more likely than all other groups surveyed.
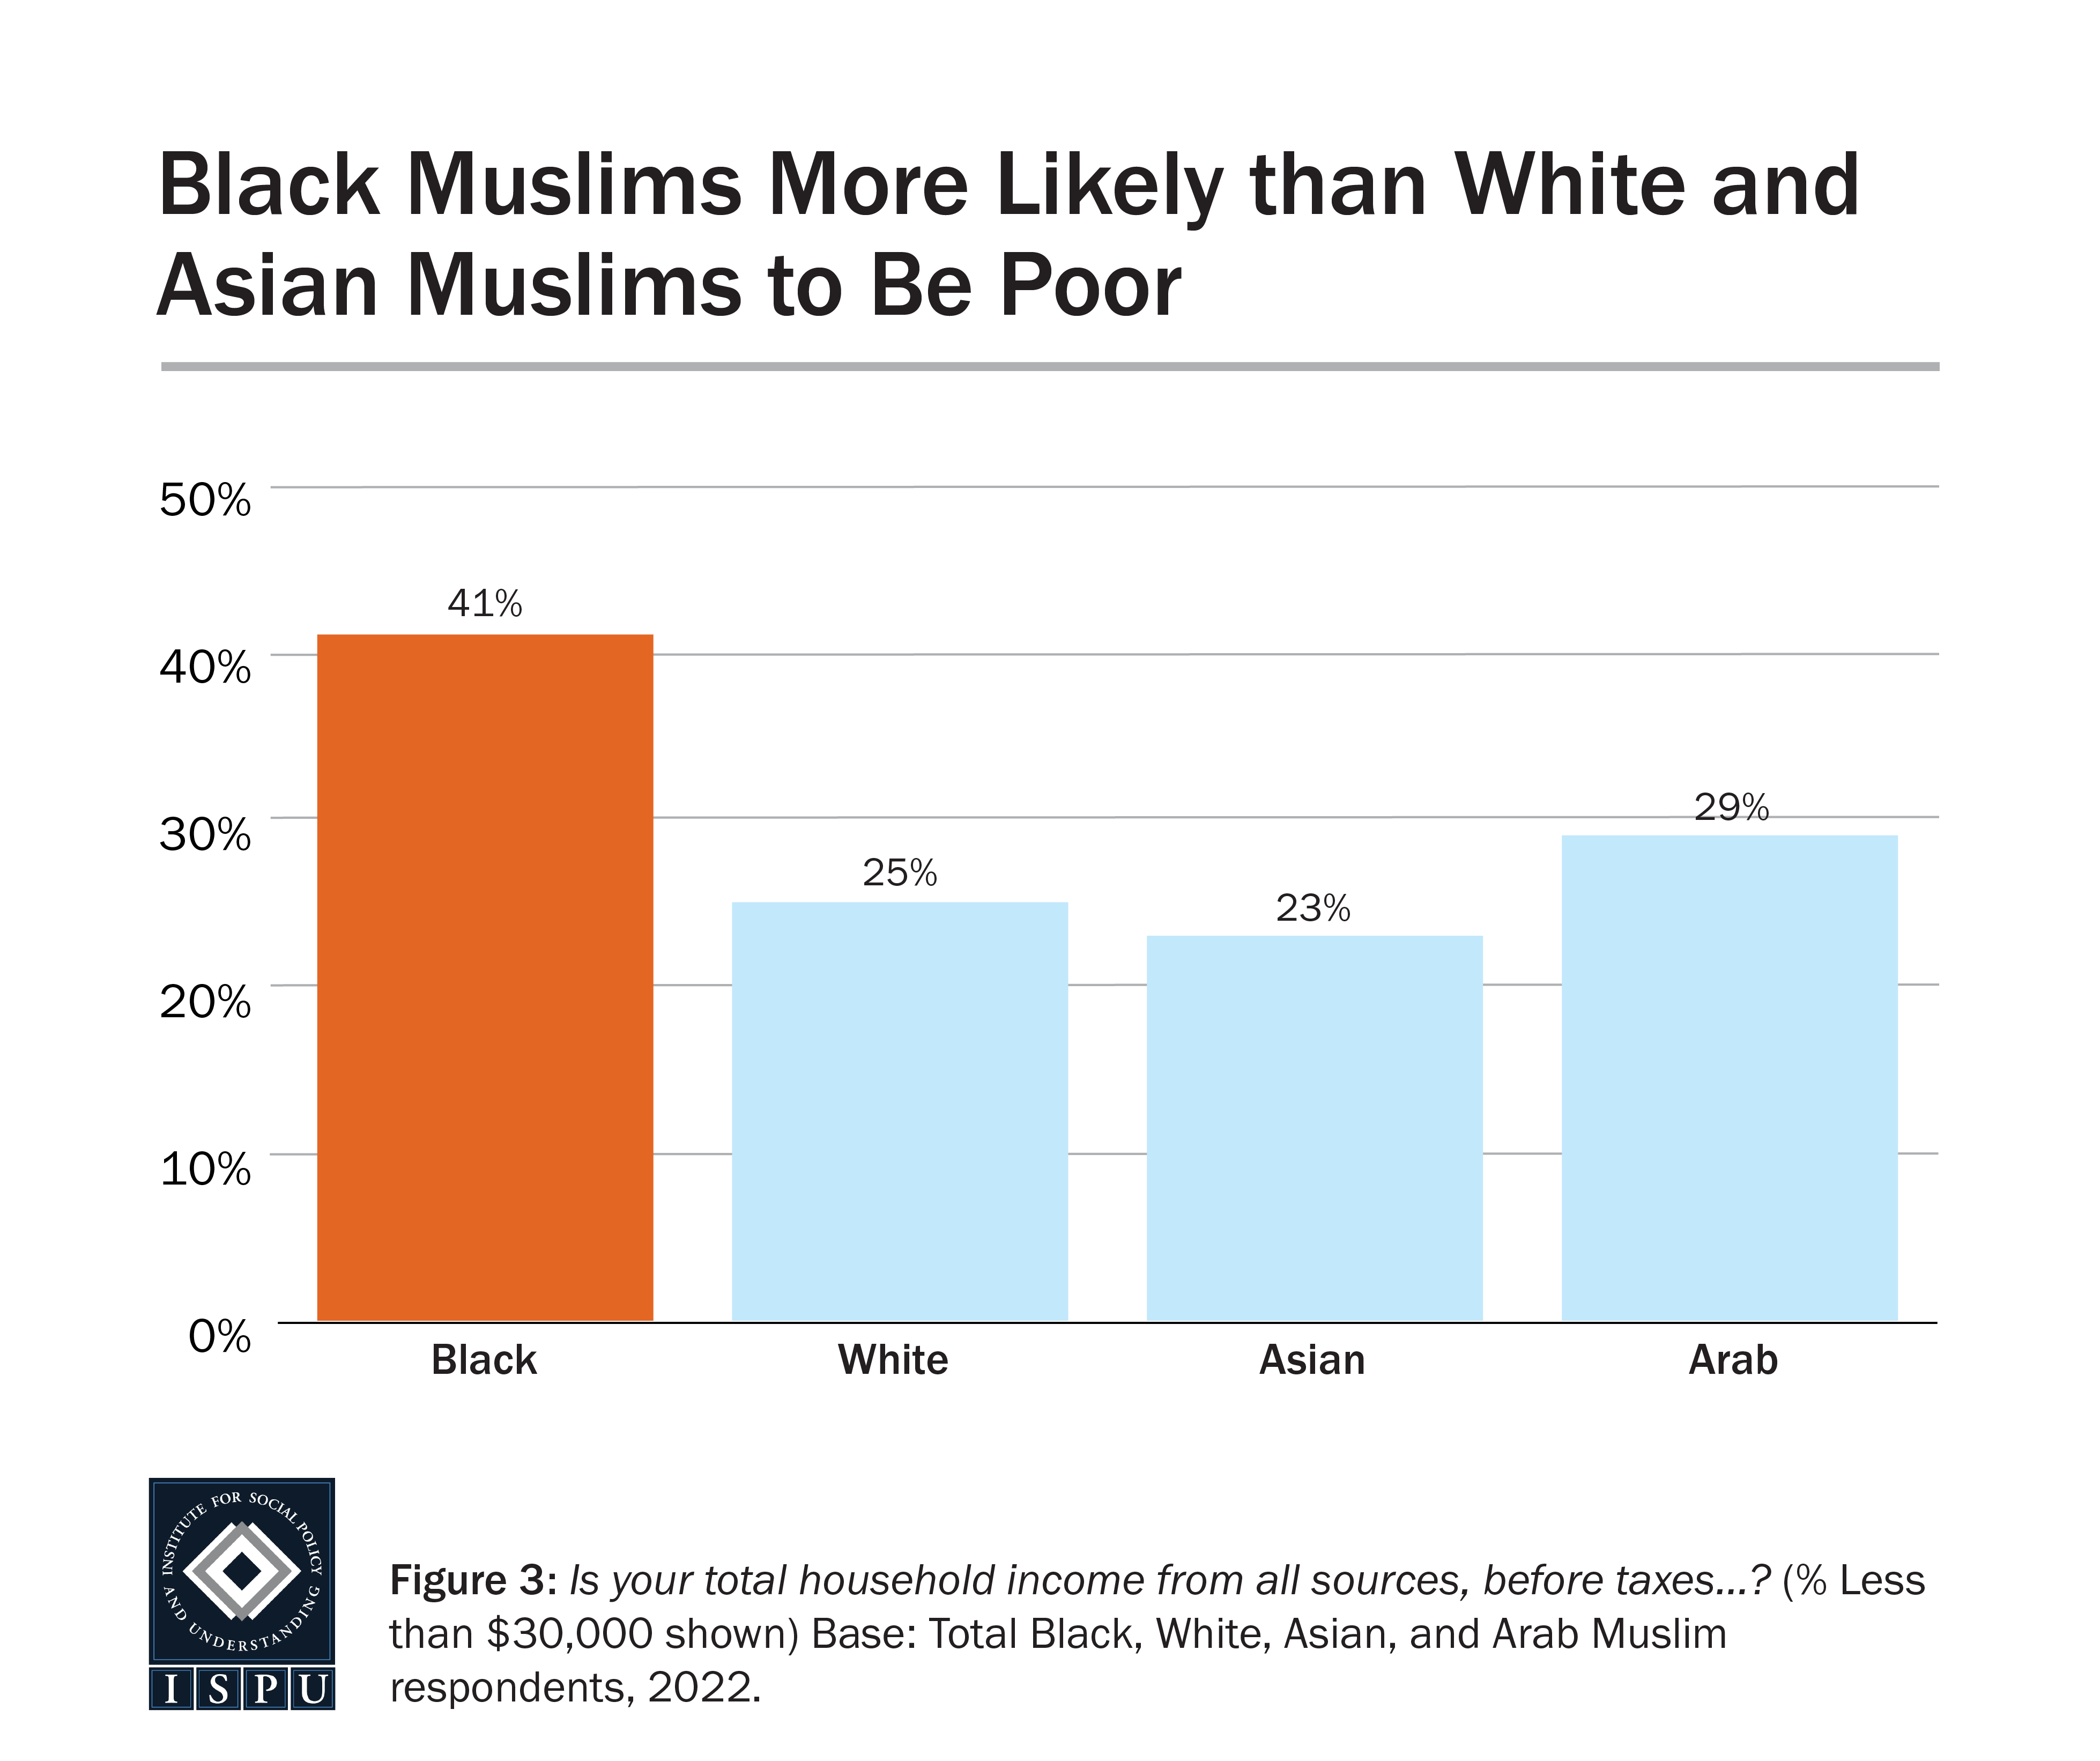
According to our survey, Black Muslims, as well as Black Americans in the wider public, are more likely to report a lower income. Four in ten Black Muslims (41%) report a household income less than $30,000, which is more than about one-quarter of white (25%) and Asian (23%) Muslims. Almost one-third of Arab Muslims (29%) report a low household income, on par with other racial/ethnic groups among Muslims. The portion of Black Muslim households with an income below $30,000 is on par with Black Americans in the general public (41% and 43%, respectively). The same is true of white Muslims and whites in the general public (25% and 21%, respectively).
Muslims on Par with Most Other Groups in Level of Education
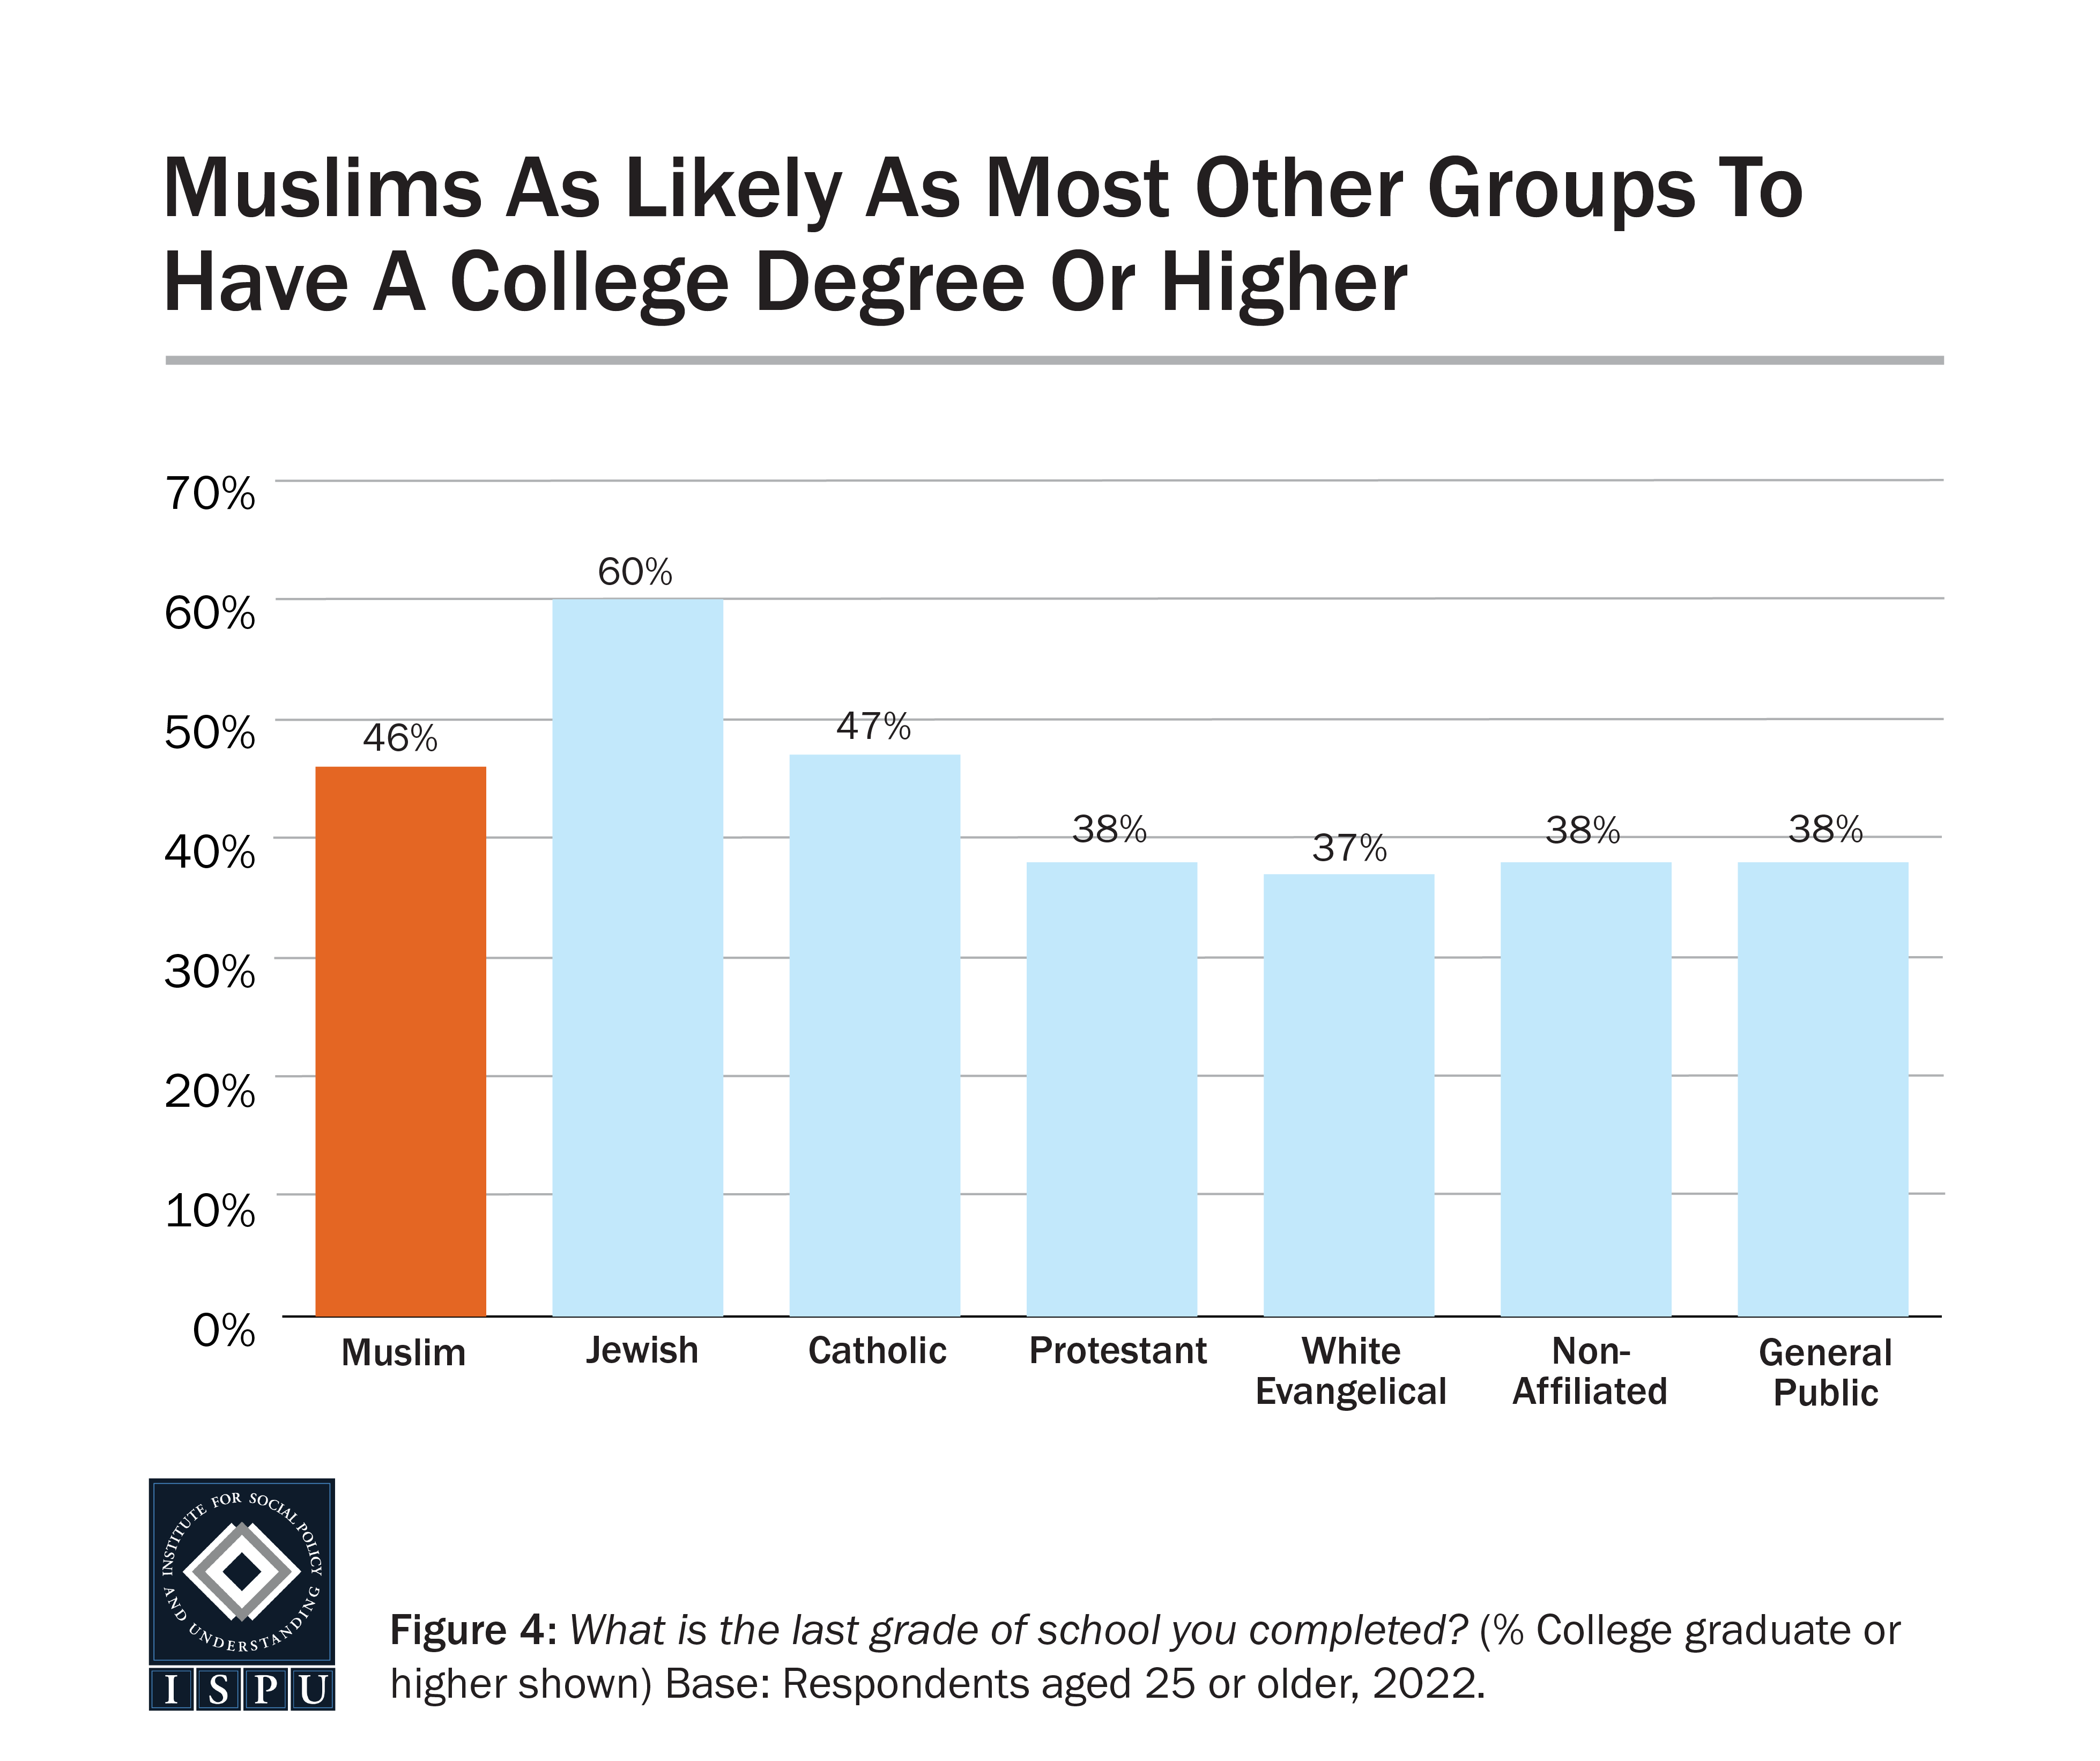
Because the American Muslim community is significantly younger than the general public, we specifically looked at education levels among Americans aged 25 years or older to get a more accurate comparison. We find American Muslims are on par with Catholics, Protestants, white Evangelicals, the nonaffiliated, and the general public in their level of education. Specifically, among those aged 25 years or older, 46% of Muslims have a college degree or higher, compared with 60% of Jews and on par with 47% of Catholics, 38% of Protestants, 37% of white Evangelicals, 38% of the nonaffiliated, and 38% of the general public.
Employment and Job Creation
Compared to Other Groups, American Muslims More Likely to Be Students, Less Likely to be Retired
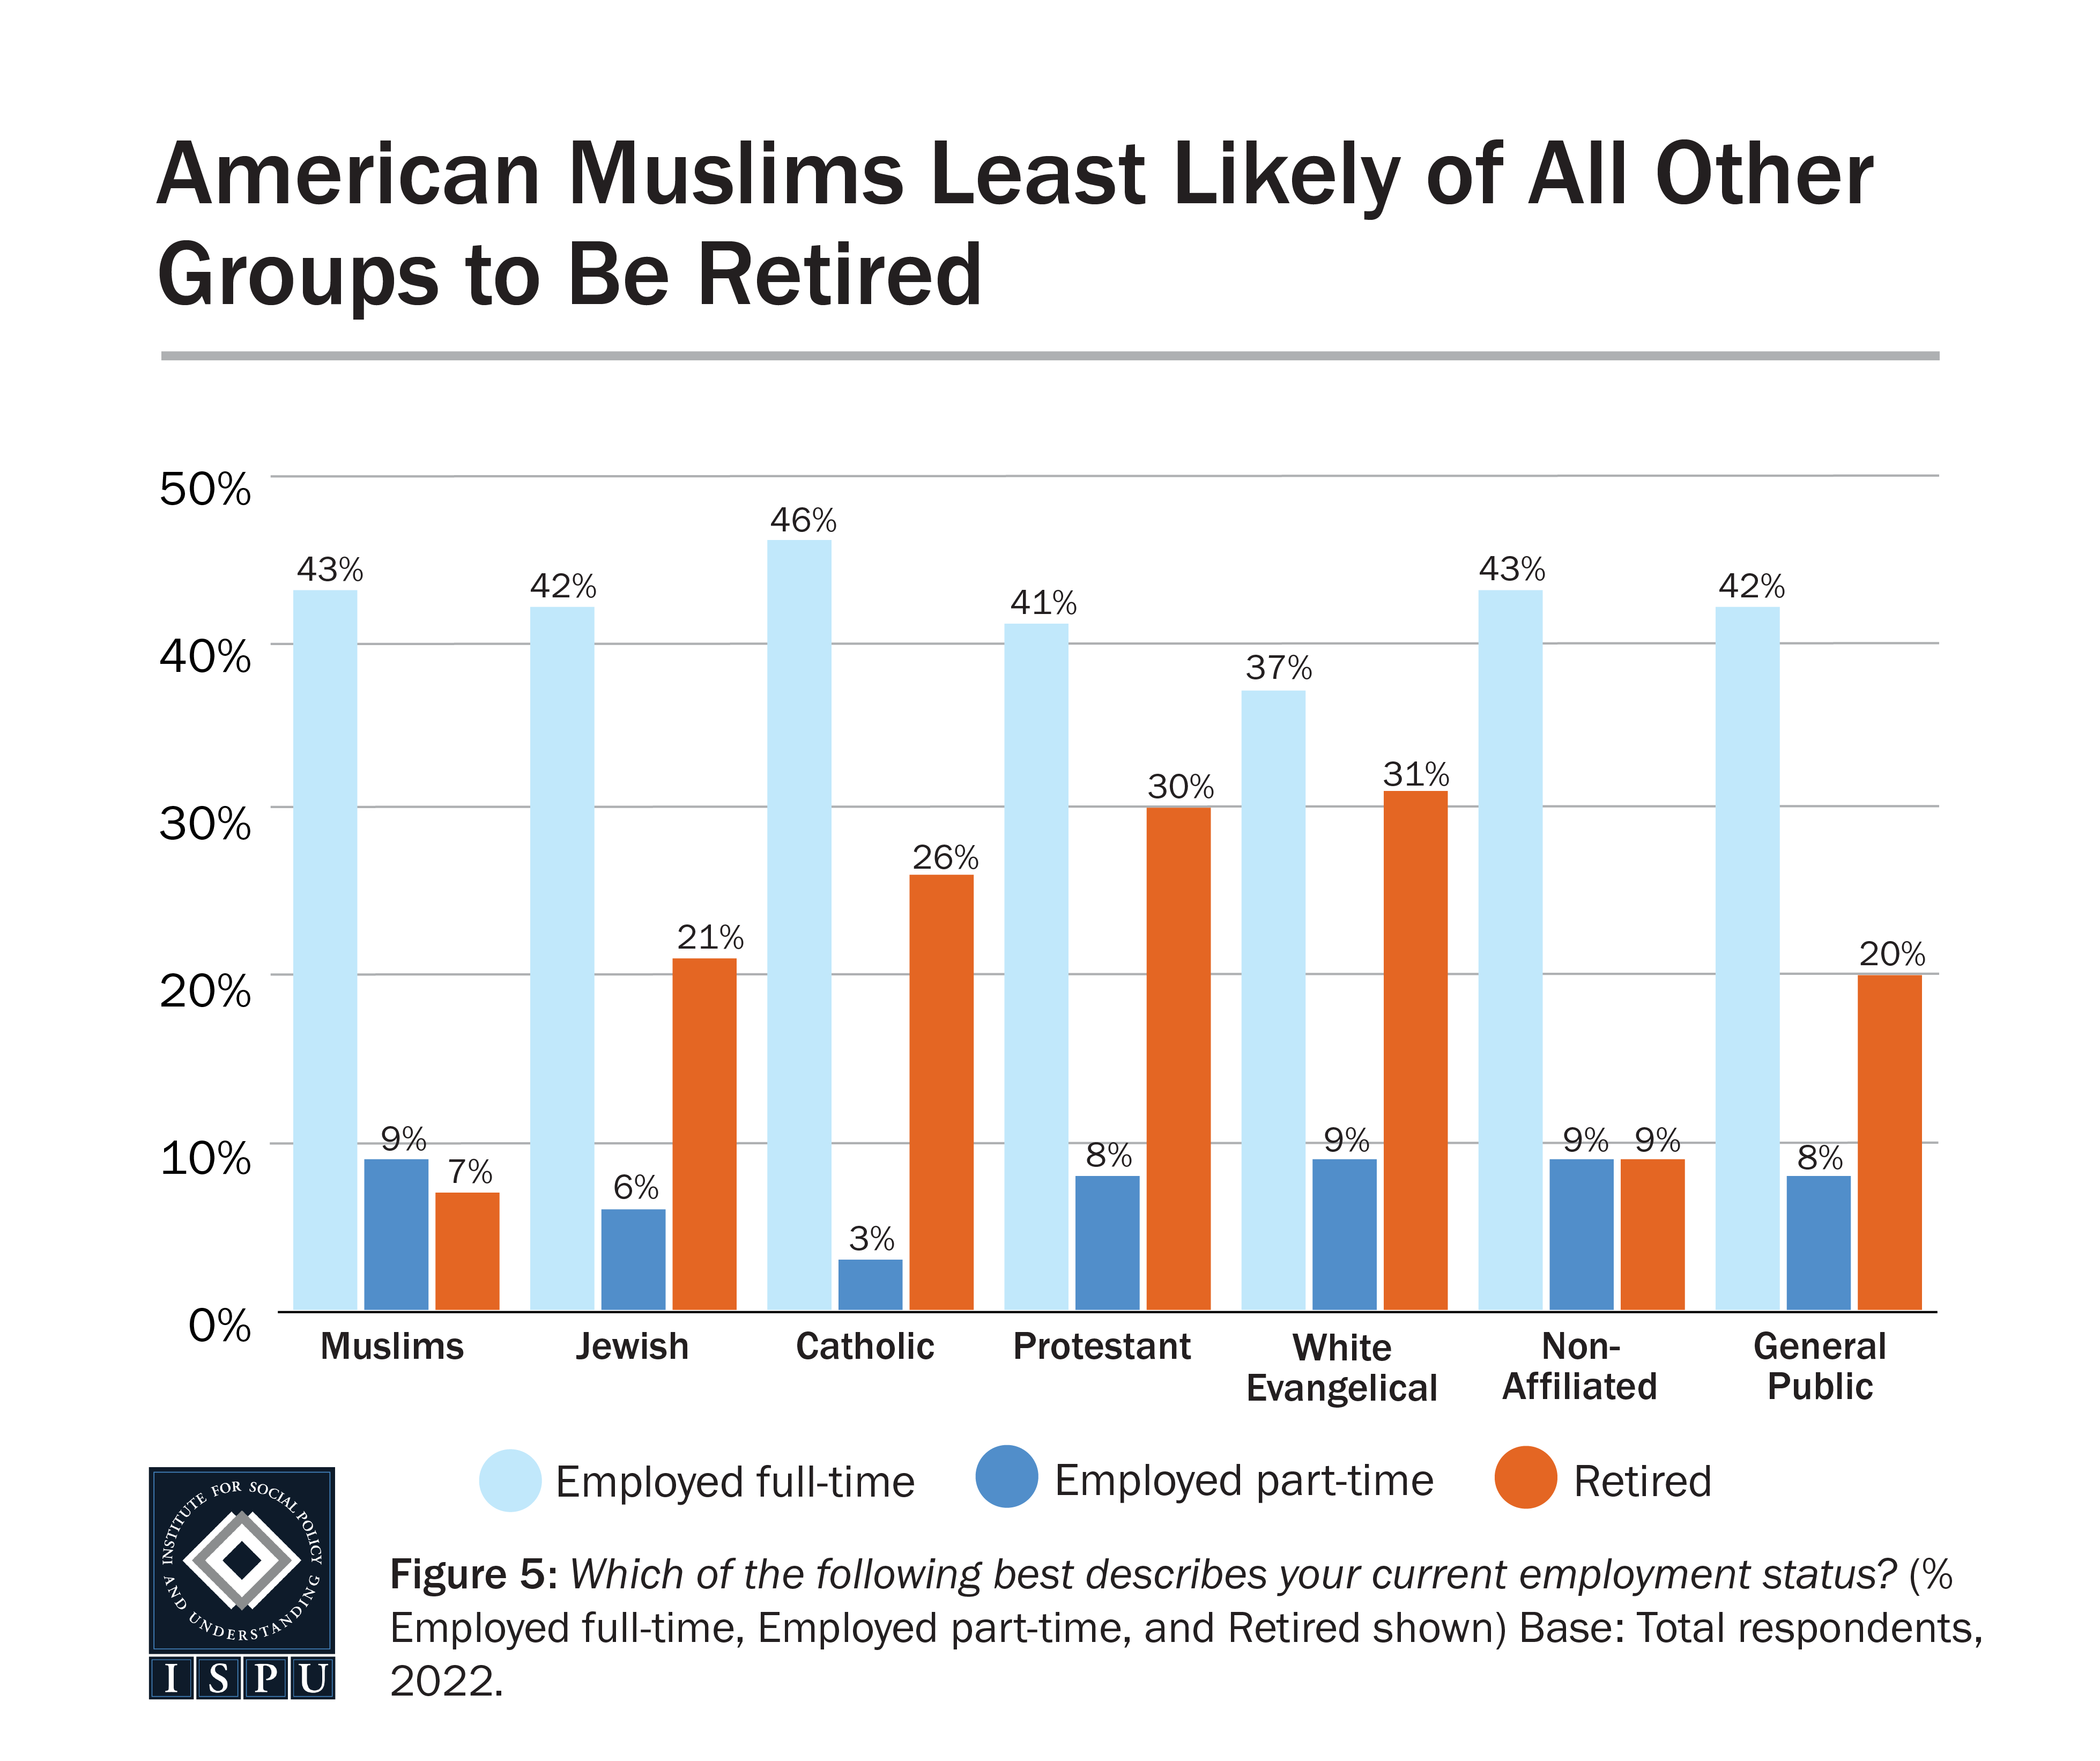
New in 2022, the American Muslim Poll included questions about employment. We find American Muslims are as likely as all other faith and non-faith groups to be employed full-time (roughly 43% among all groups surveyed). Muslims are also as likely as all other groups except Catholics to be employed part time (9% of Muslims vs. 3% of Catholics). However, Muslims are far less likely to be retired (7% vs. 21% to 31% of other faith groups), reflecting Muslims’ younger average age (see Fig 5).
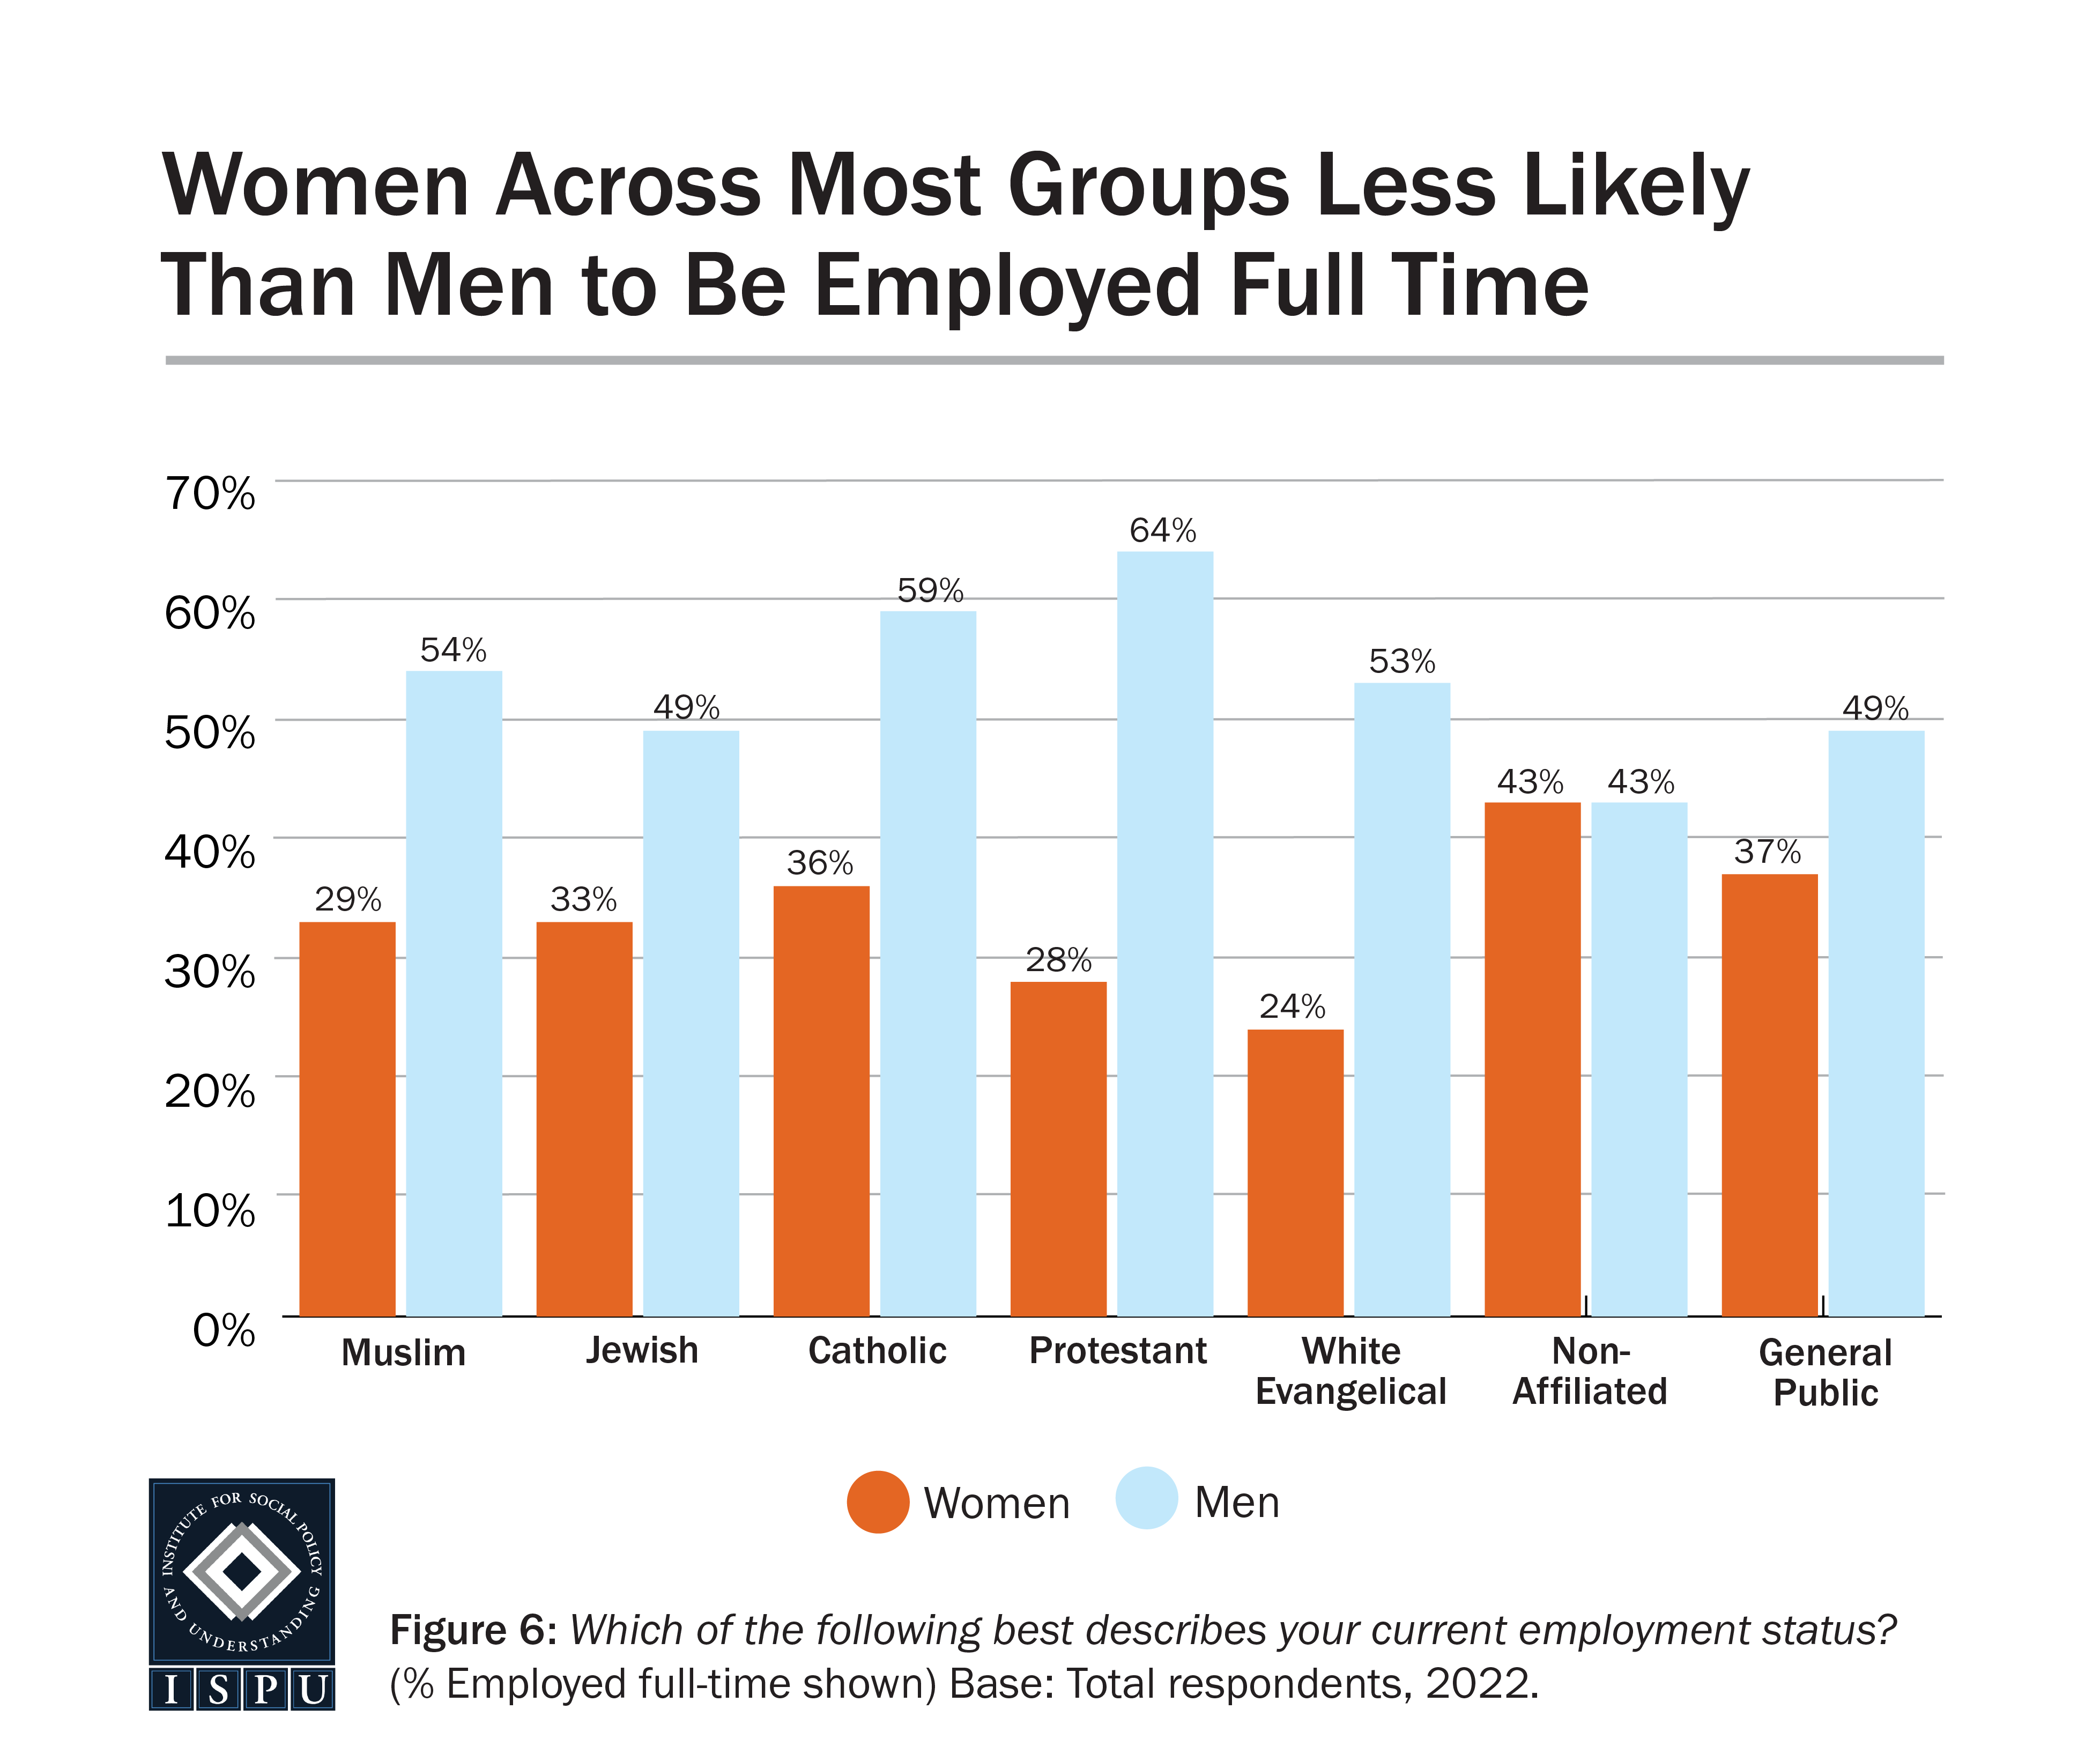
Among Muslims, Catholics, Protestants, white Evangelicals, and the general public, men are more likely than women to be employed full-time (see Fig. 6). In other words, Muslim women are similar to women of other faiths in their employment status as compared with men.
Among Muslims, 13% are currently students, more likely than Jews (3%), Catholics and Protestants (both 4%), white Evangelicals (0%), and the general public (5%) but on par with the nonaffiliated (8%), again reflecting Muslims’ younger average age. Muslims are at least three times more likely than all Christian groups to be temporarily unemployed (7% vs. 1-2%), a finding in line with our earlier research finding that Muslims were more likely than the general public to have lost their job due to the pandemic.
Roughly One in Ten Muslims Are Self-Employed
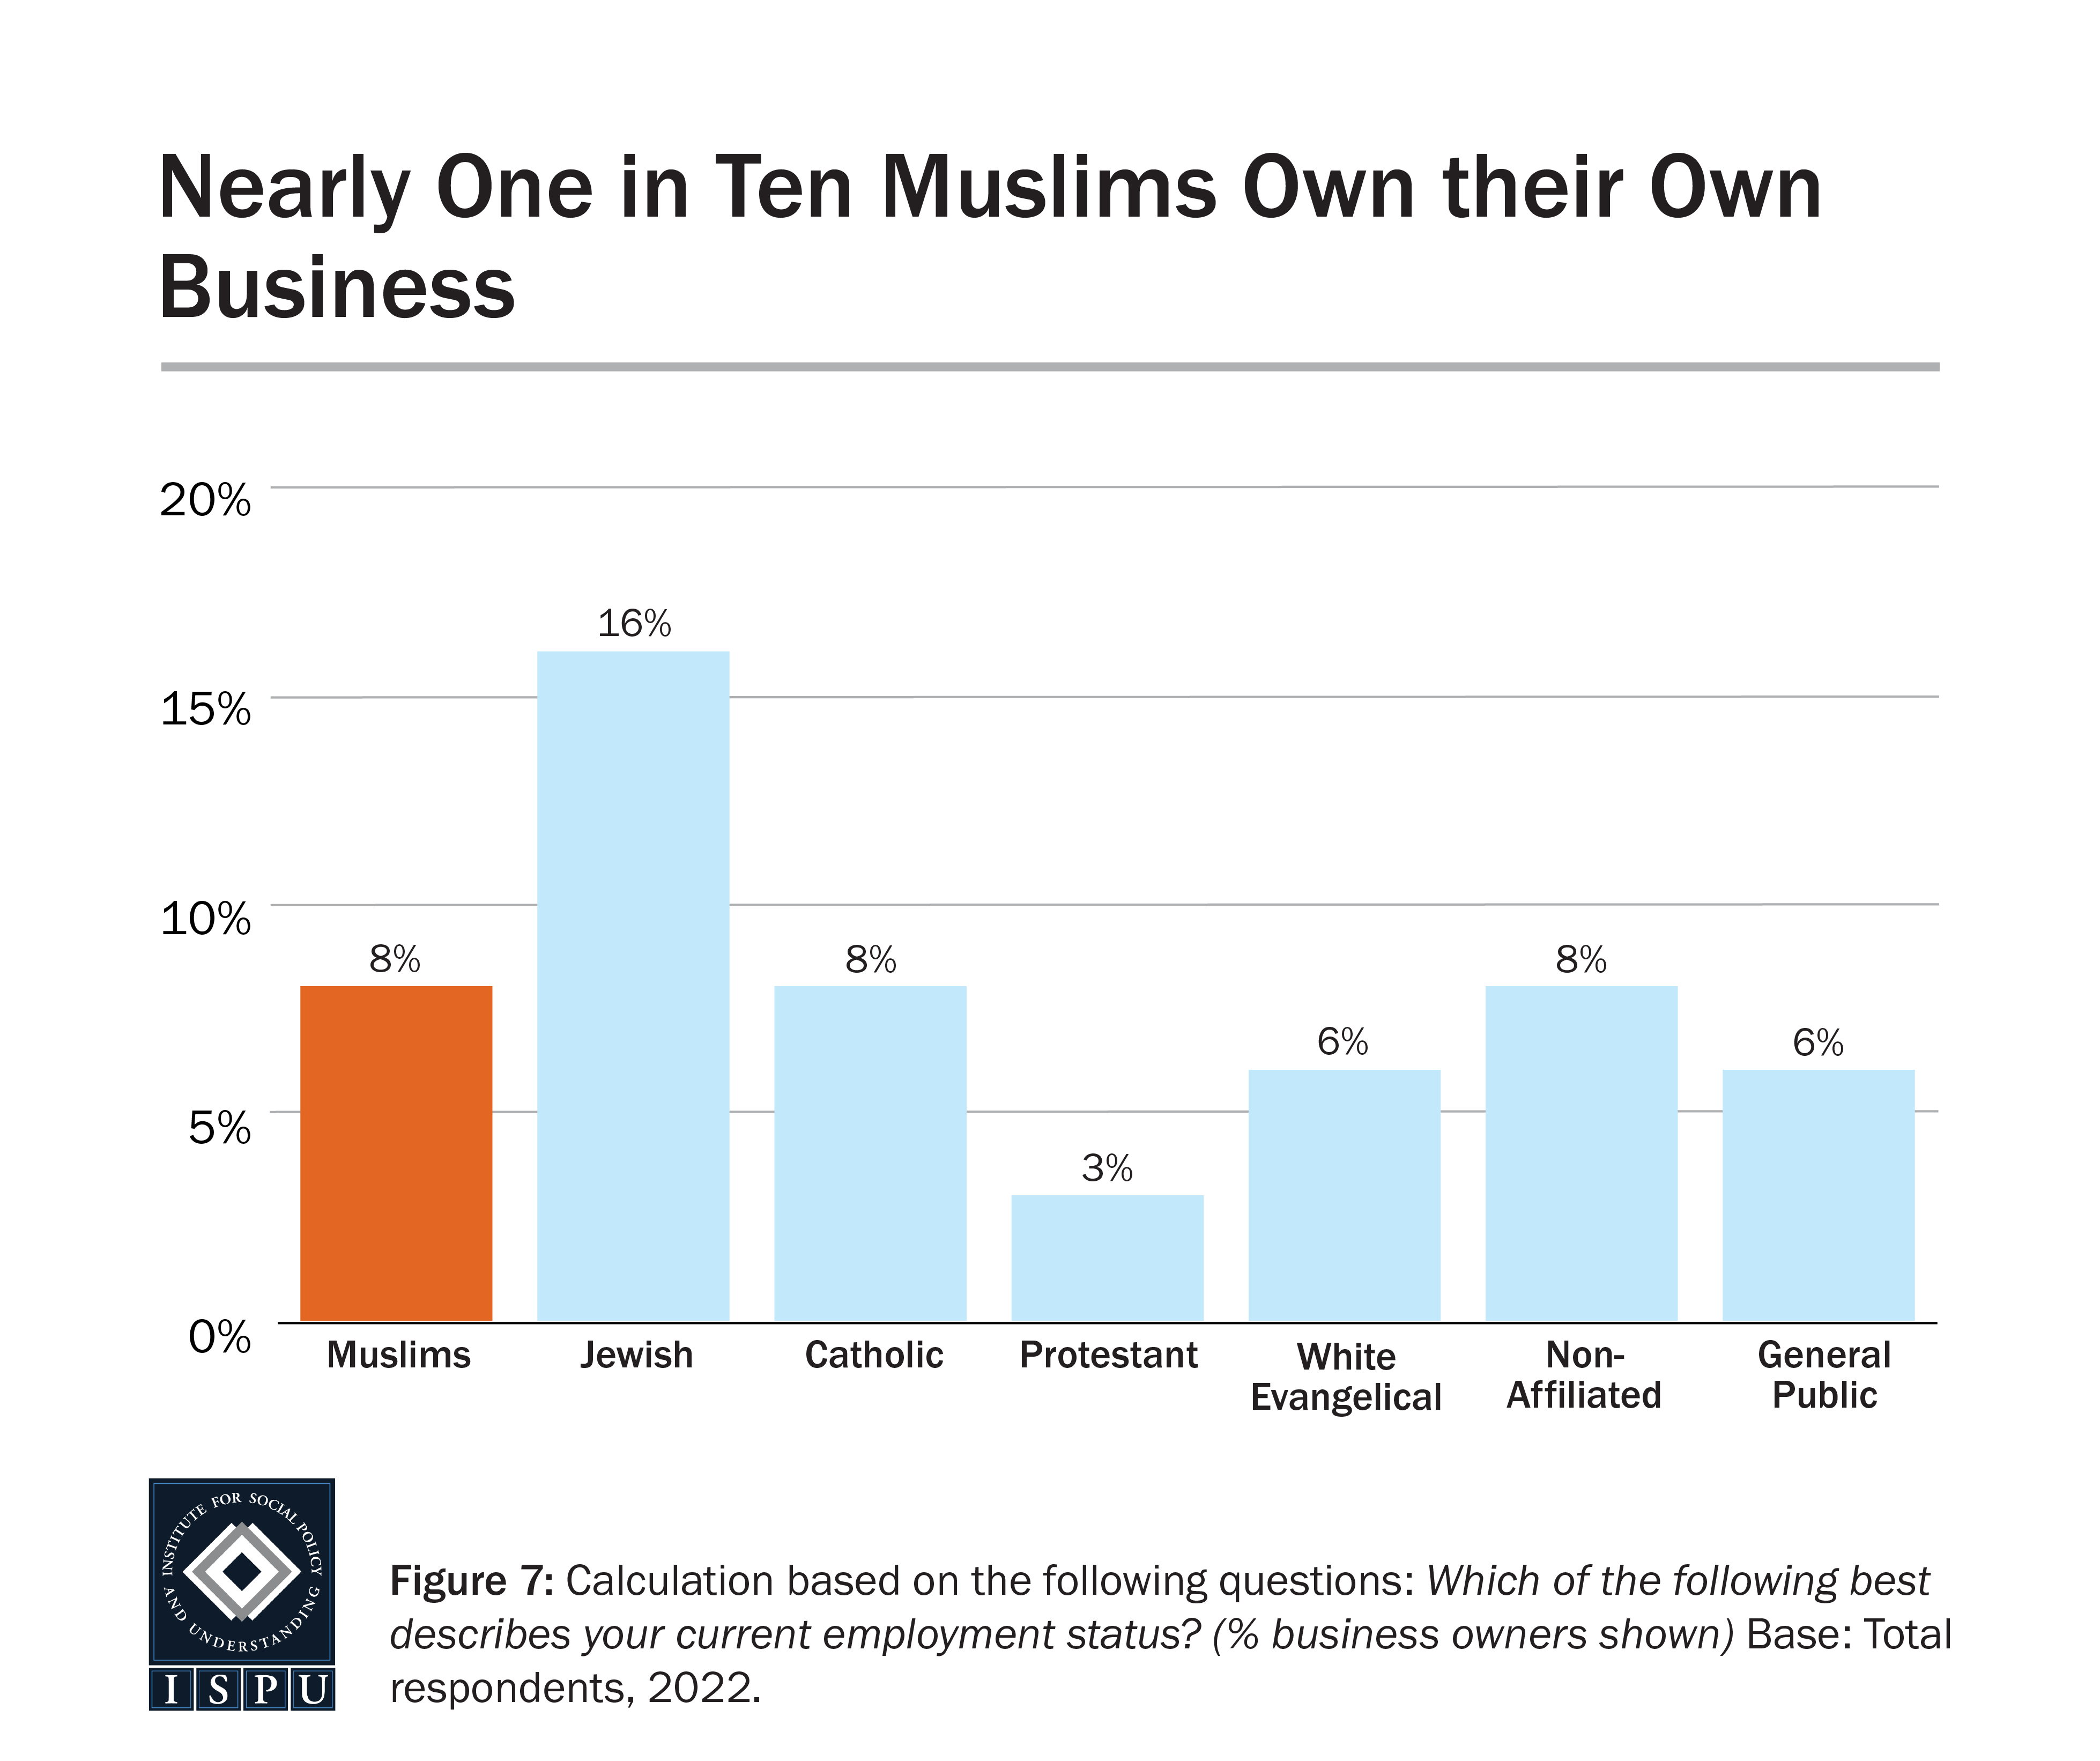
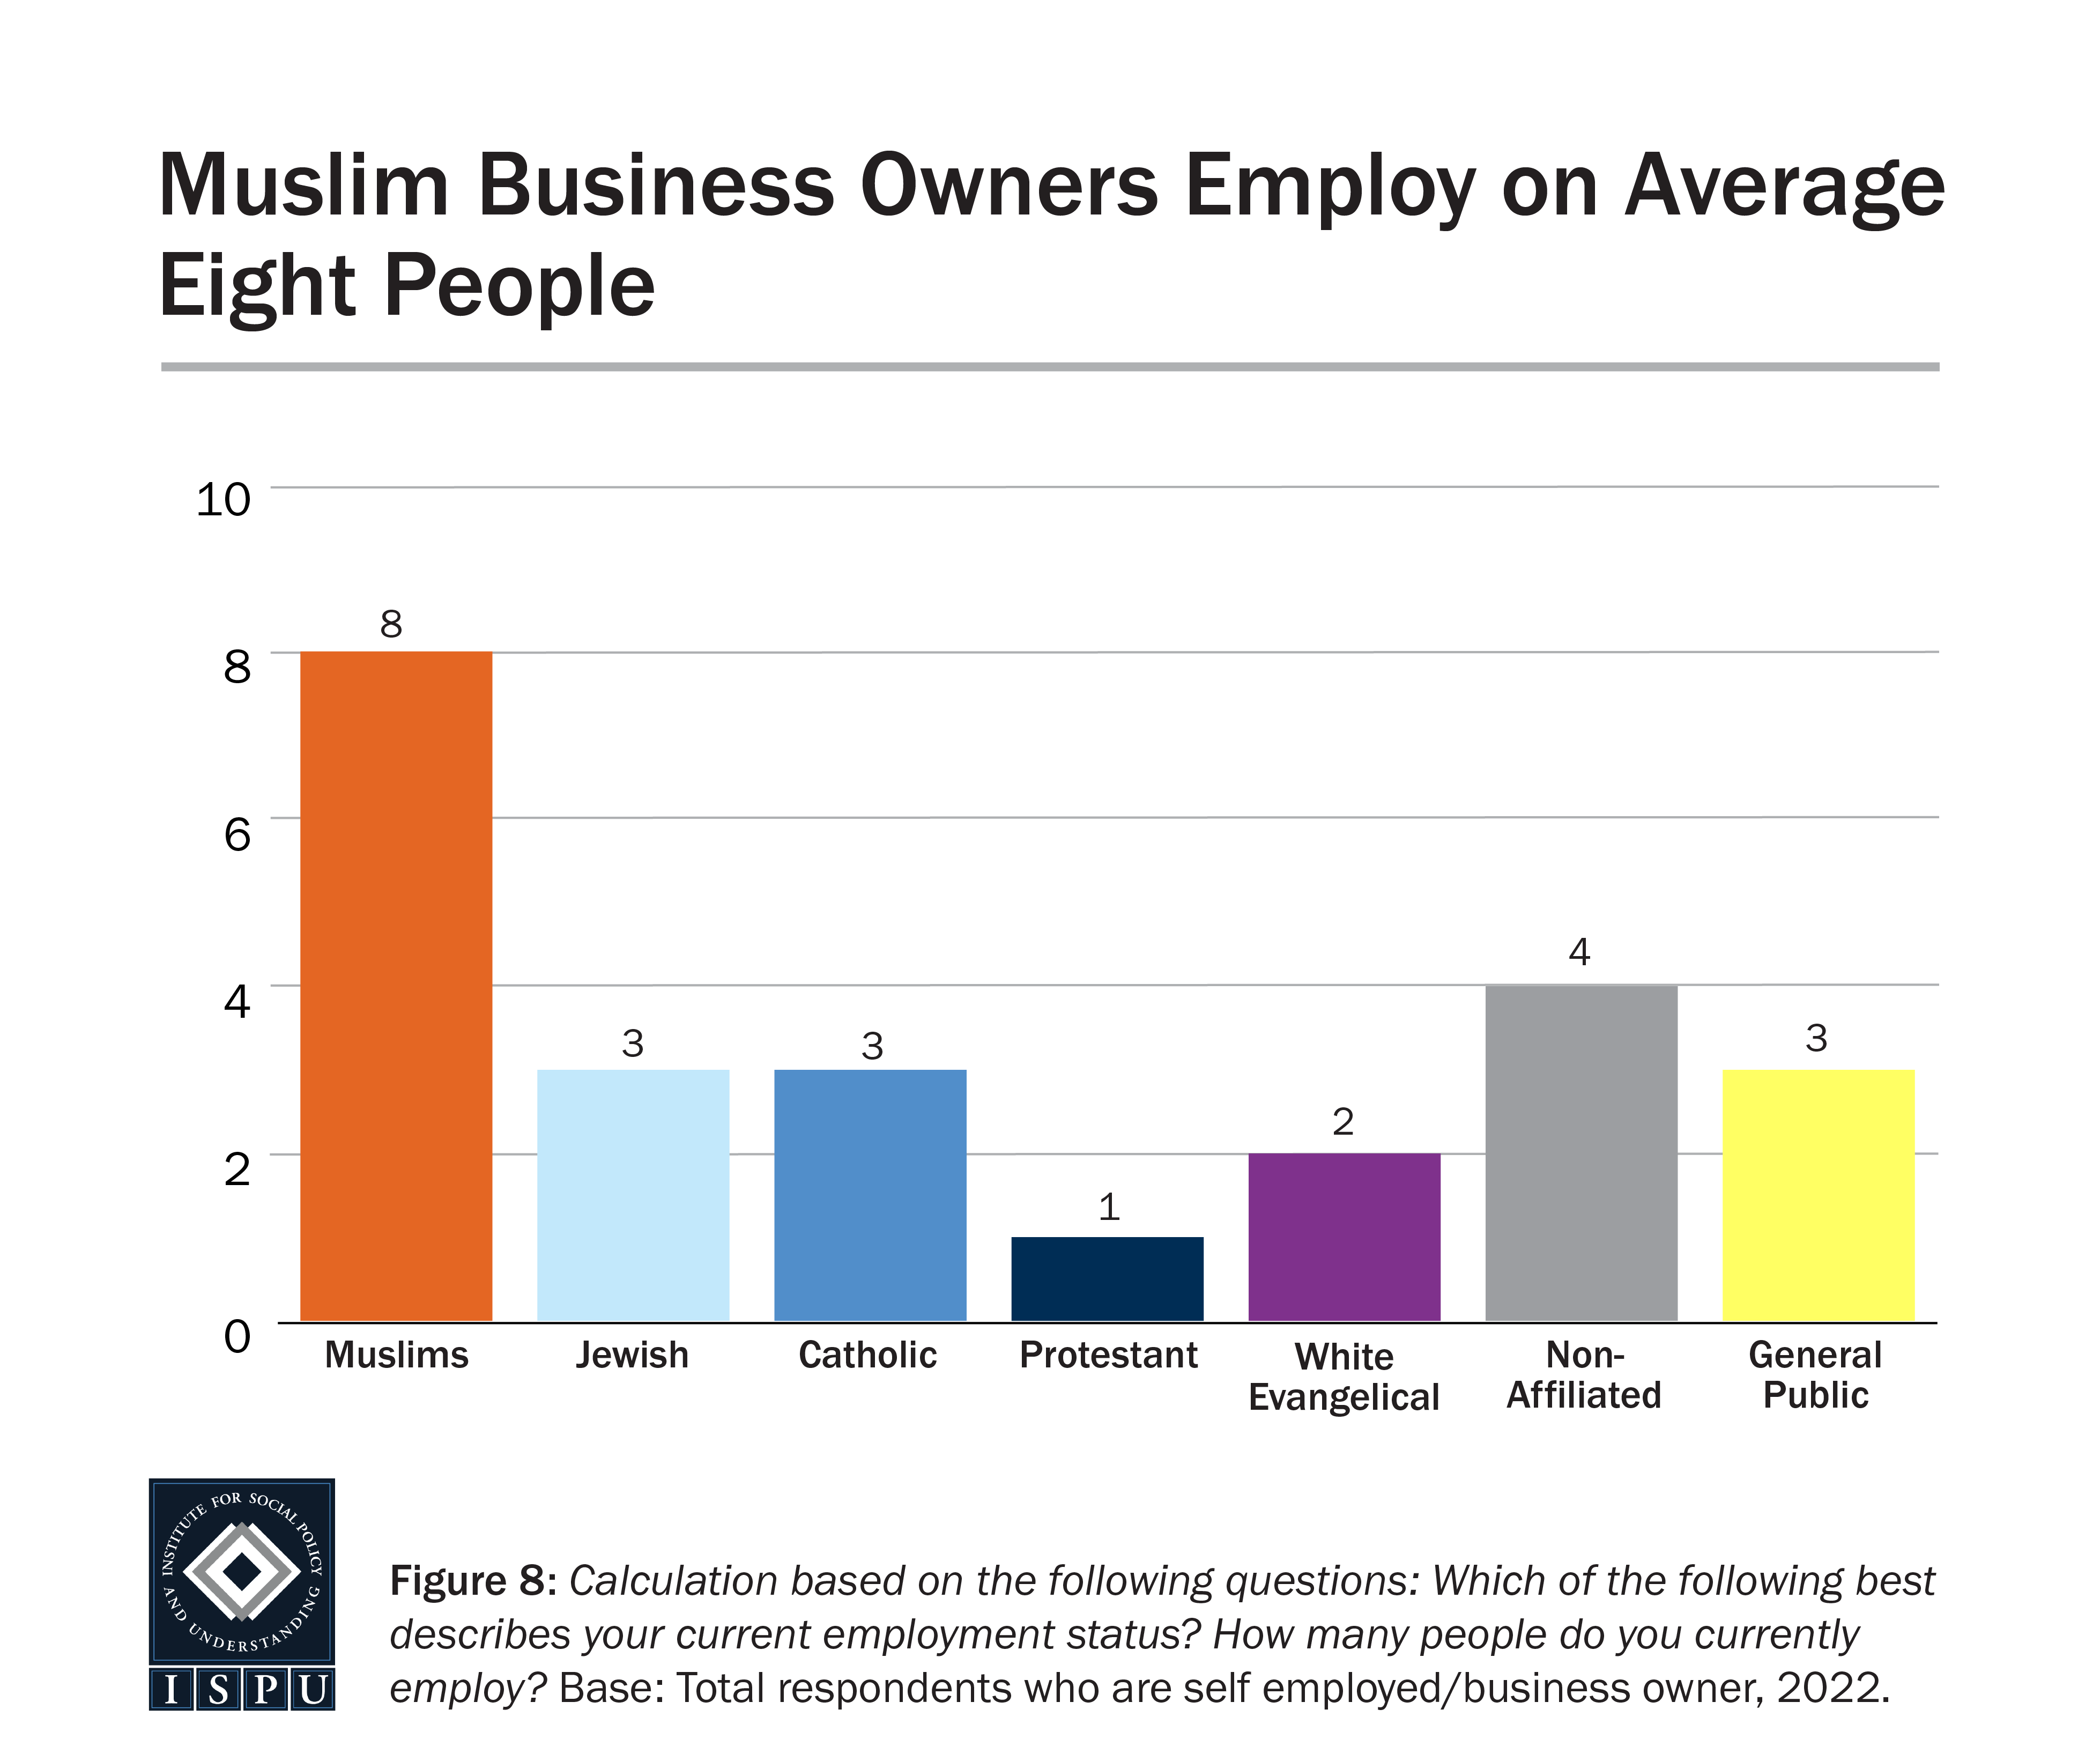
Nearly one in ten Muslims (8%) report being self-employed or owning their own business, as likely as Catholics (8%), white Evangelicals (6%), the nonaffiliated (8%), and the general public (6%), but less likely than Jews (16%), and more likely than Protestants (3%). Muslim men (9%) and Muslim women (7%) are equally likely to own their own business or be self-employed. Among the self-employed, Muslims employ a weighted average of eight workers each, resulting in the creation of at least 1.37 million American jobs.
Muslims employ a weighted average of eight workers each, resulting in the creation of at least 1.37 million American jobs.
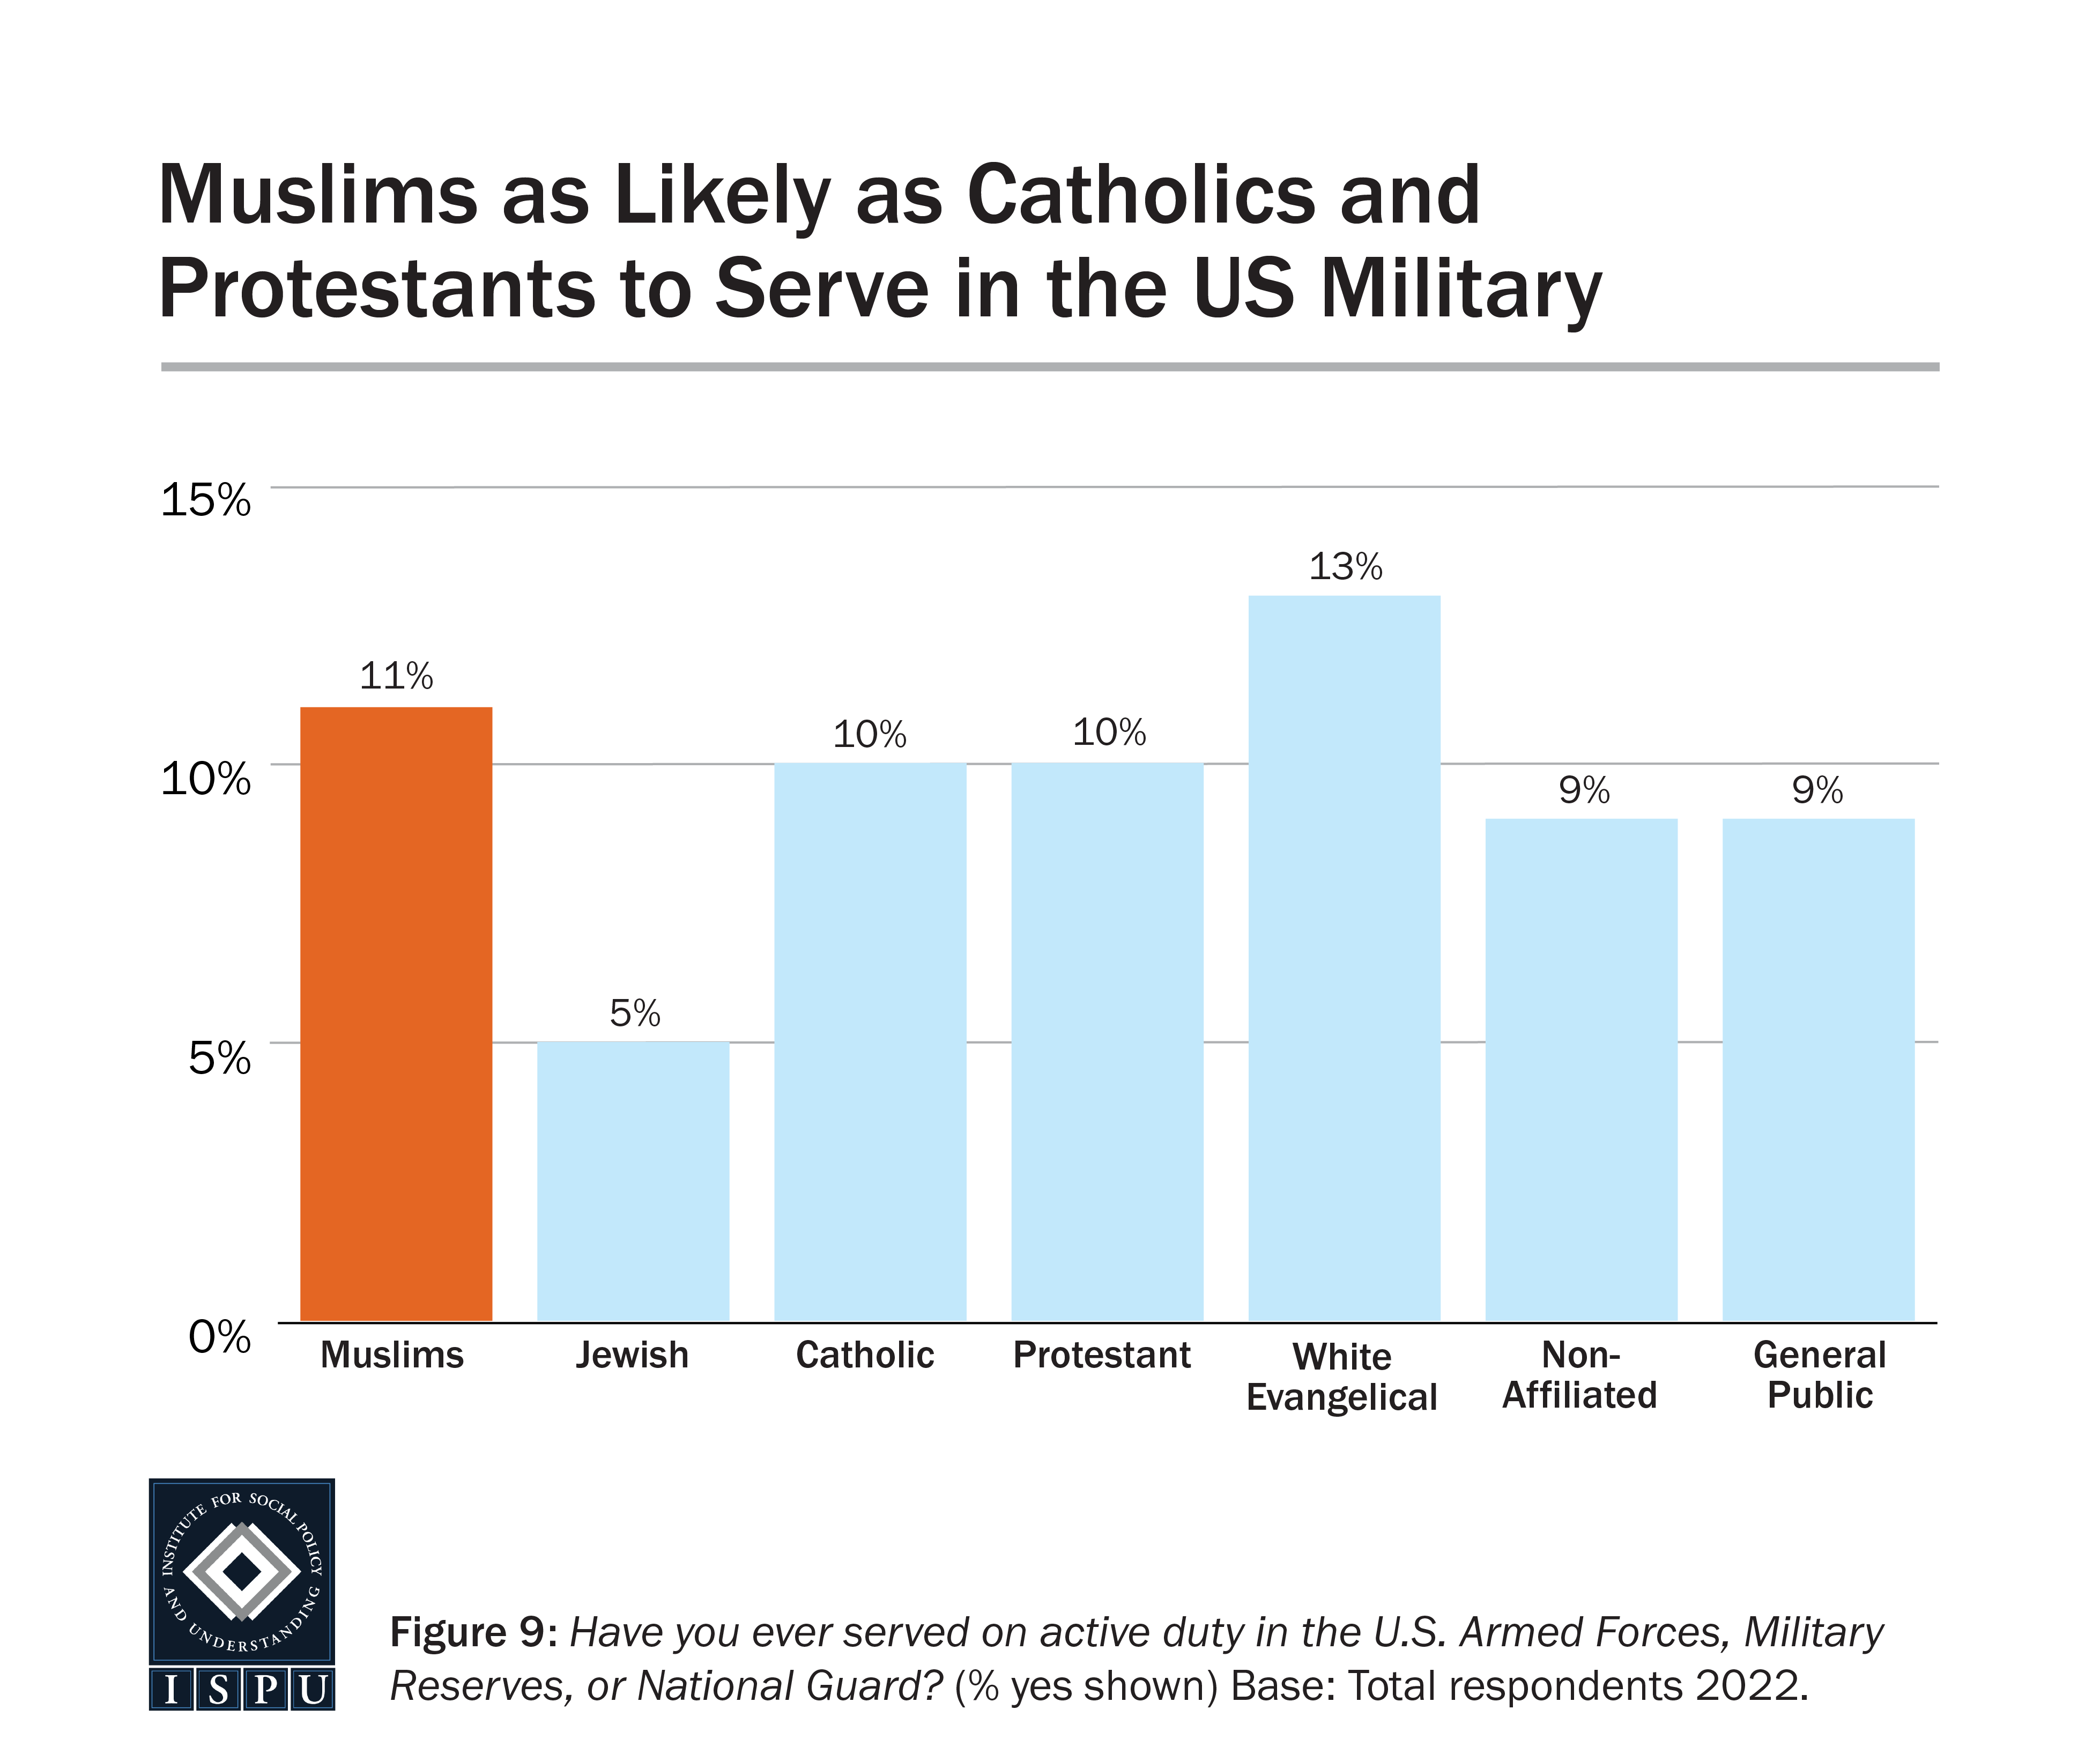
Muslims as Likely as Other Faith and Non-Faith Groups to Serve in the US Military
Despite being the least likely group surveyed to hold US citizenship, Muslims were as likely as other groups to serve in the military. About four in five Muslims are US citizens (83%), compared to 99% of Jews, 94% of Catholics, 99% of Protestants and white Evangelicals, 92% of the nonaffiliated, and 95% of the general public. At 11%, Muslims were more likely to serve in the military than Jews (5%) and as likely as Catholics (10%), Protestants (10%), white Evangelicals (13%), the nonaffiliated (9%), and the general public (9%).
Looking at military service by race/ethnicity, we find white Muslims are more likely than Asian and Arab Muslims to have served in the military (17% vs. 4% and <1%, respectively). Additionally, Black Muslims are more likely than Arab Muslims to have served in the military (10% vs. <1%); however, Black Muslims and Asian Muslims are on par. Black Muslims are as likely as Black Americans in the general public to serve in the military, both at 10%. On the other hand, white Muslims were more likely than white Americans in the general public to have served (17% vs. 11%, respectively).
Faith
Just as the COVID-19 pandemic made significant impacts on the income, employment, and education of Americans, it also impacted the practice of faith, with many reporting higher religious practice as a consequence of the pandemic. According to previous research, though as likely as other Americans to seek out mental health support when in distress, Muslims were far more likely than their counterparts in the general public to cope with mental health challenges by also relying on faith and family. Faith remains an important part of Muslim life, and Muslims are more likely to report an increase in their devotion throughout the past two years of pandemic than a decrease.
American Muslims among the Most Devoted to Their Faith
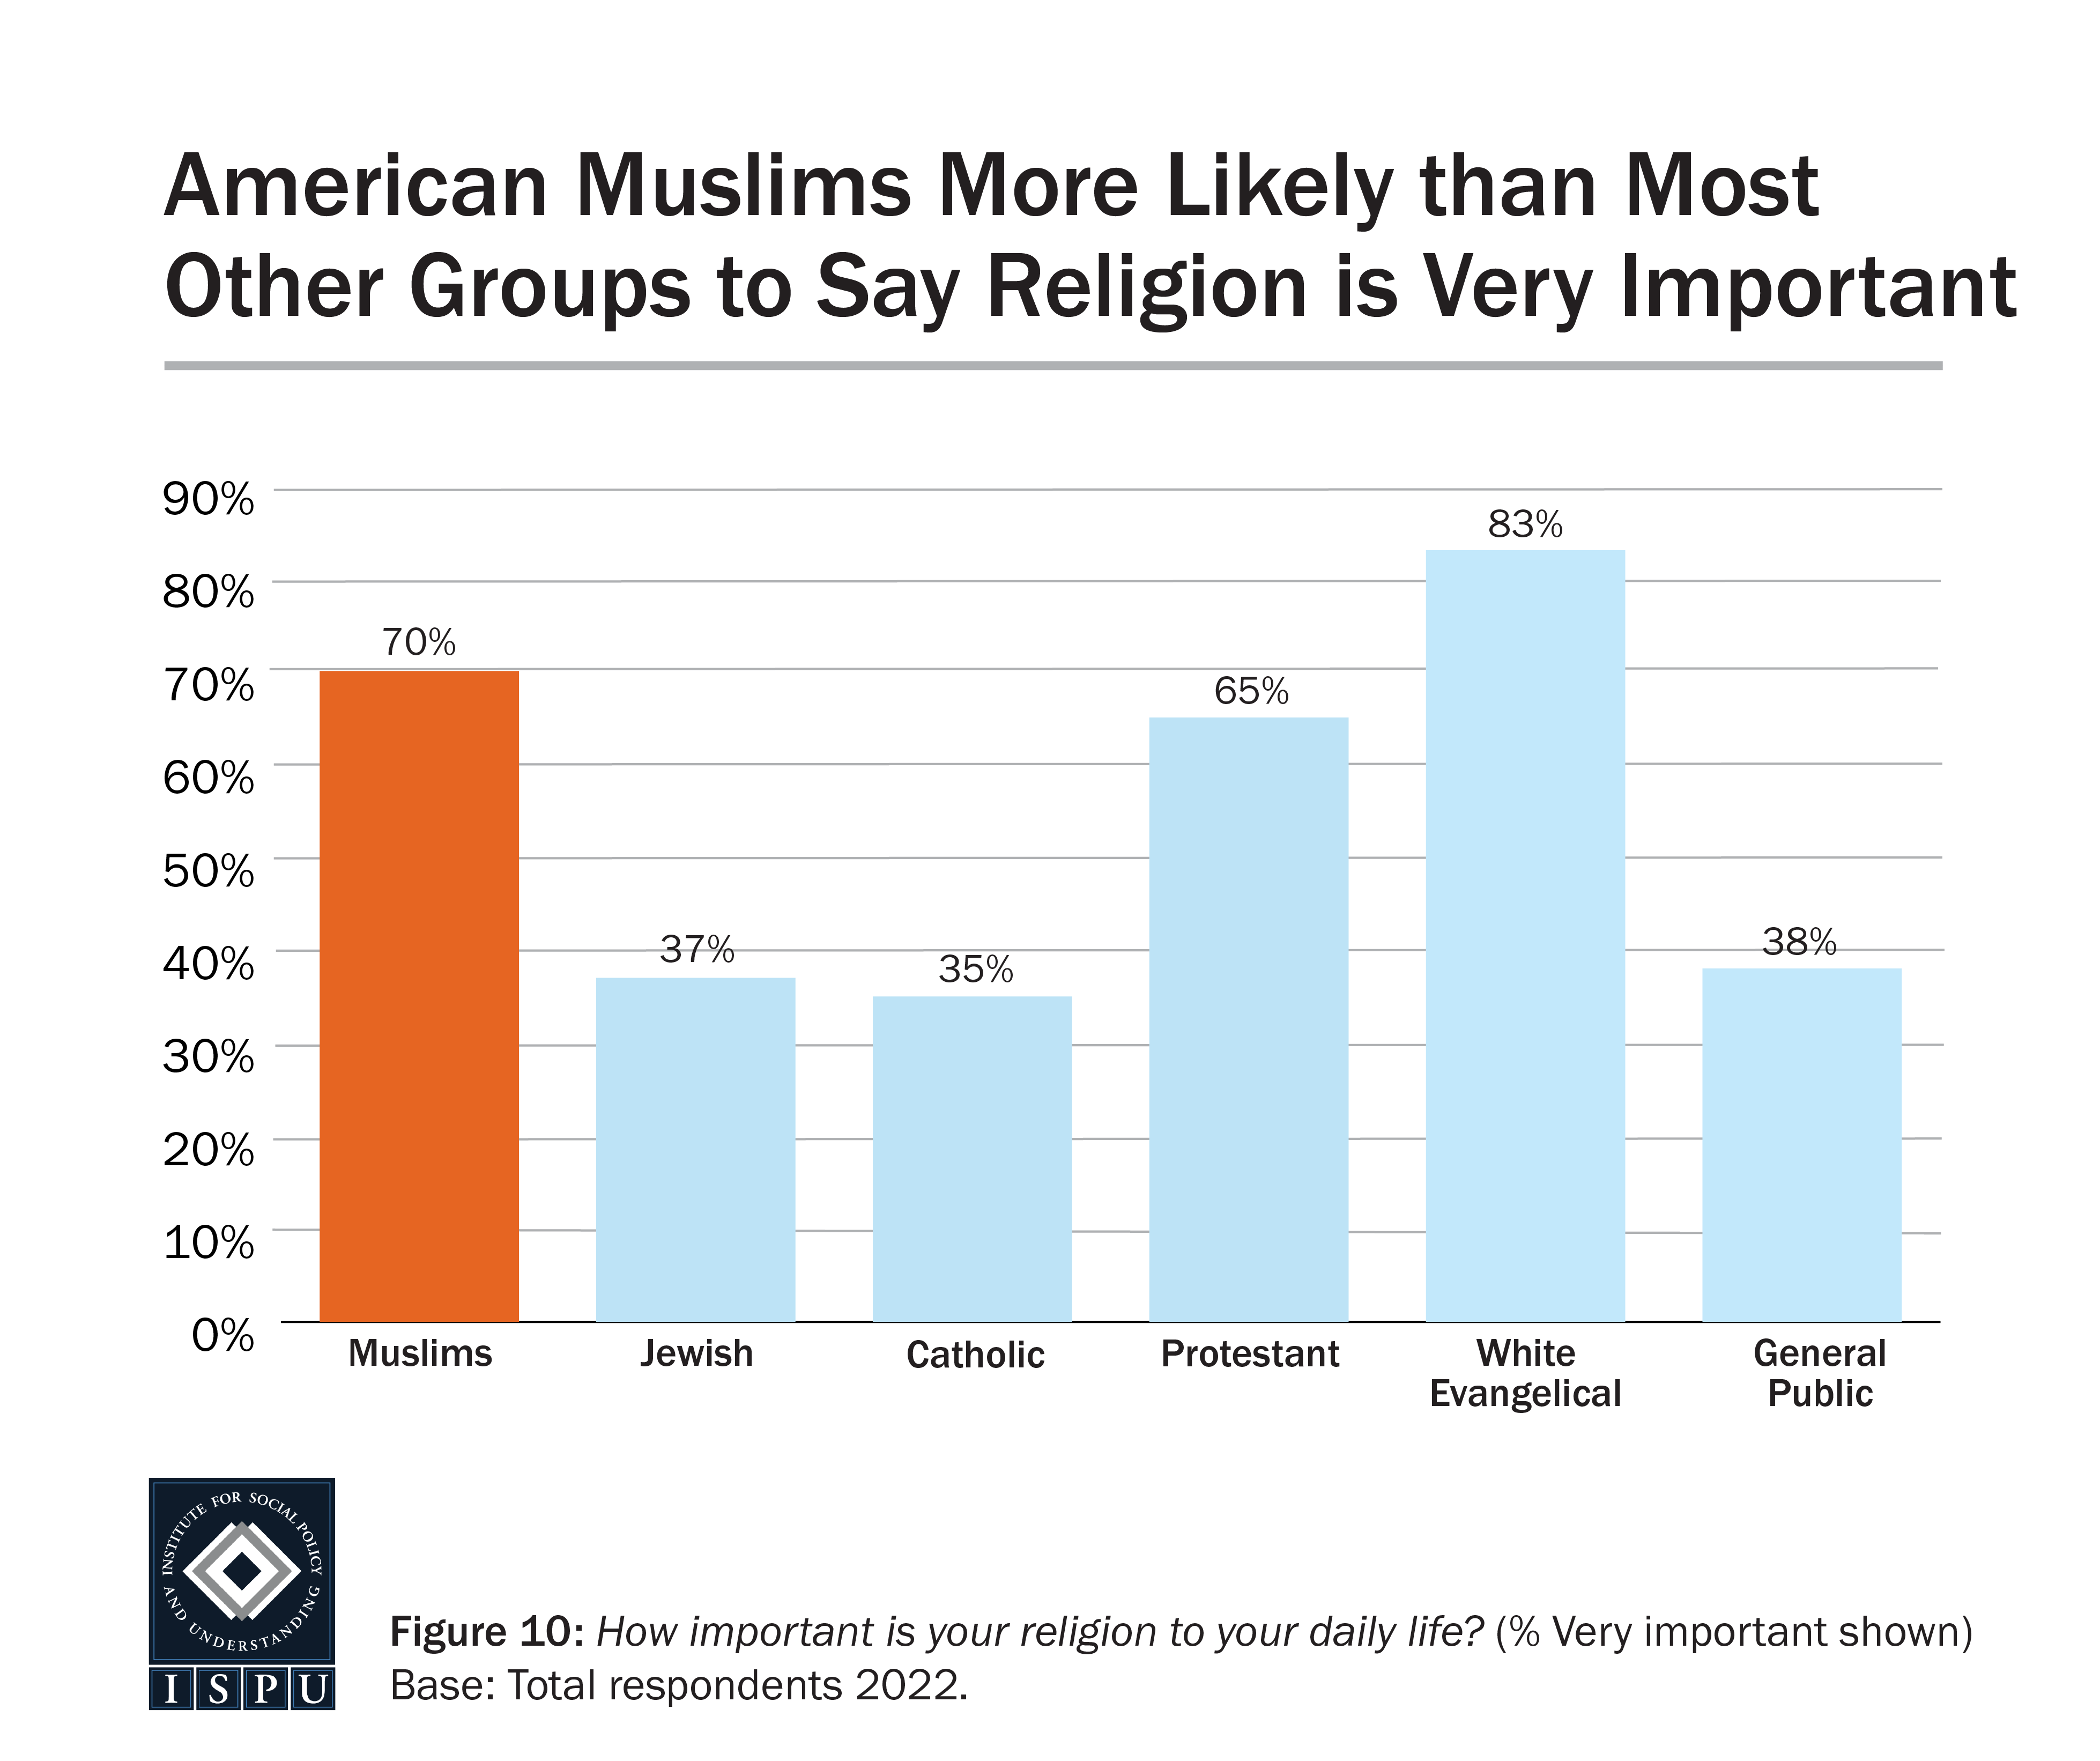
In American Muslim Poll 2022, we find American Muslims remain among the most religiously devoted, second only to white Evangelicals. Seven in ten Muslims say religion is ‘very important’ to them, higher than Jews (37%), Catholics (35%), and the general public (38%) and on par with Protestants (65%). At 83%, white Evangelicals are the most likely group to say religion is ‘very important.’ Muslim men and women were on par in their view that religion is ‘very important’ to their daily life (71% of Muslim men and 69% of Muslim women), unlike the general public whereas women (43%) are more likely than men (33%) to rate religion as very important.
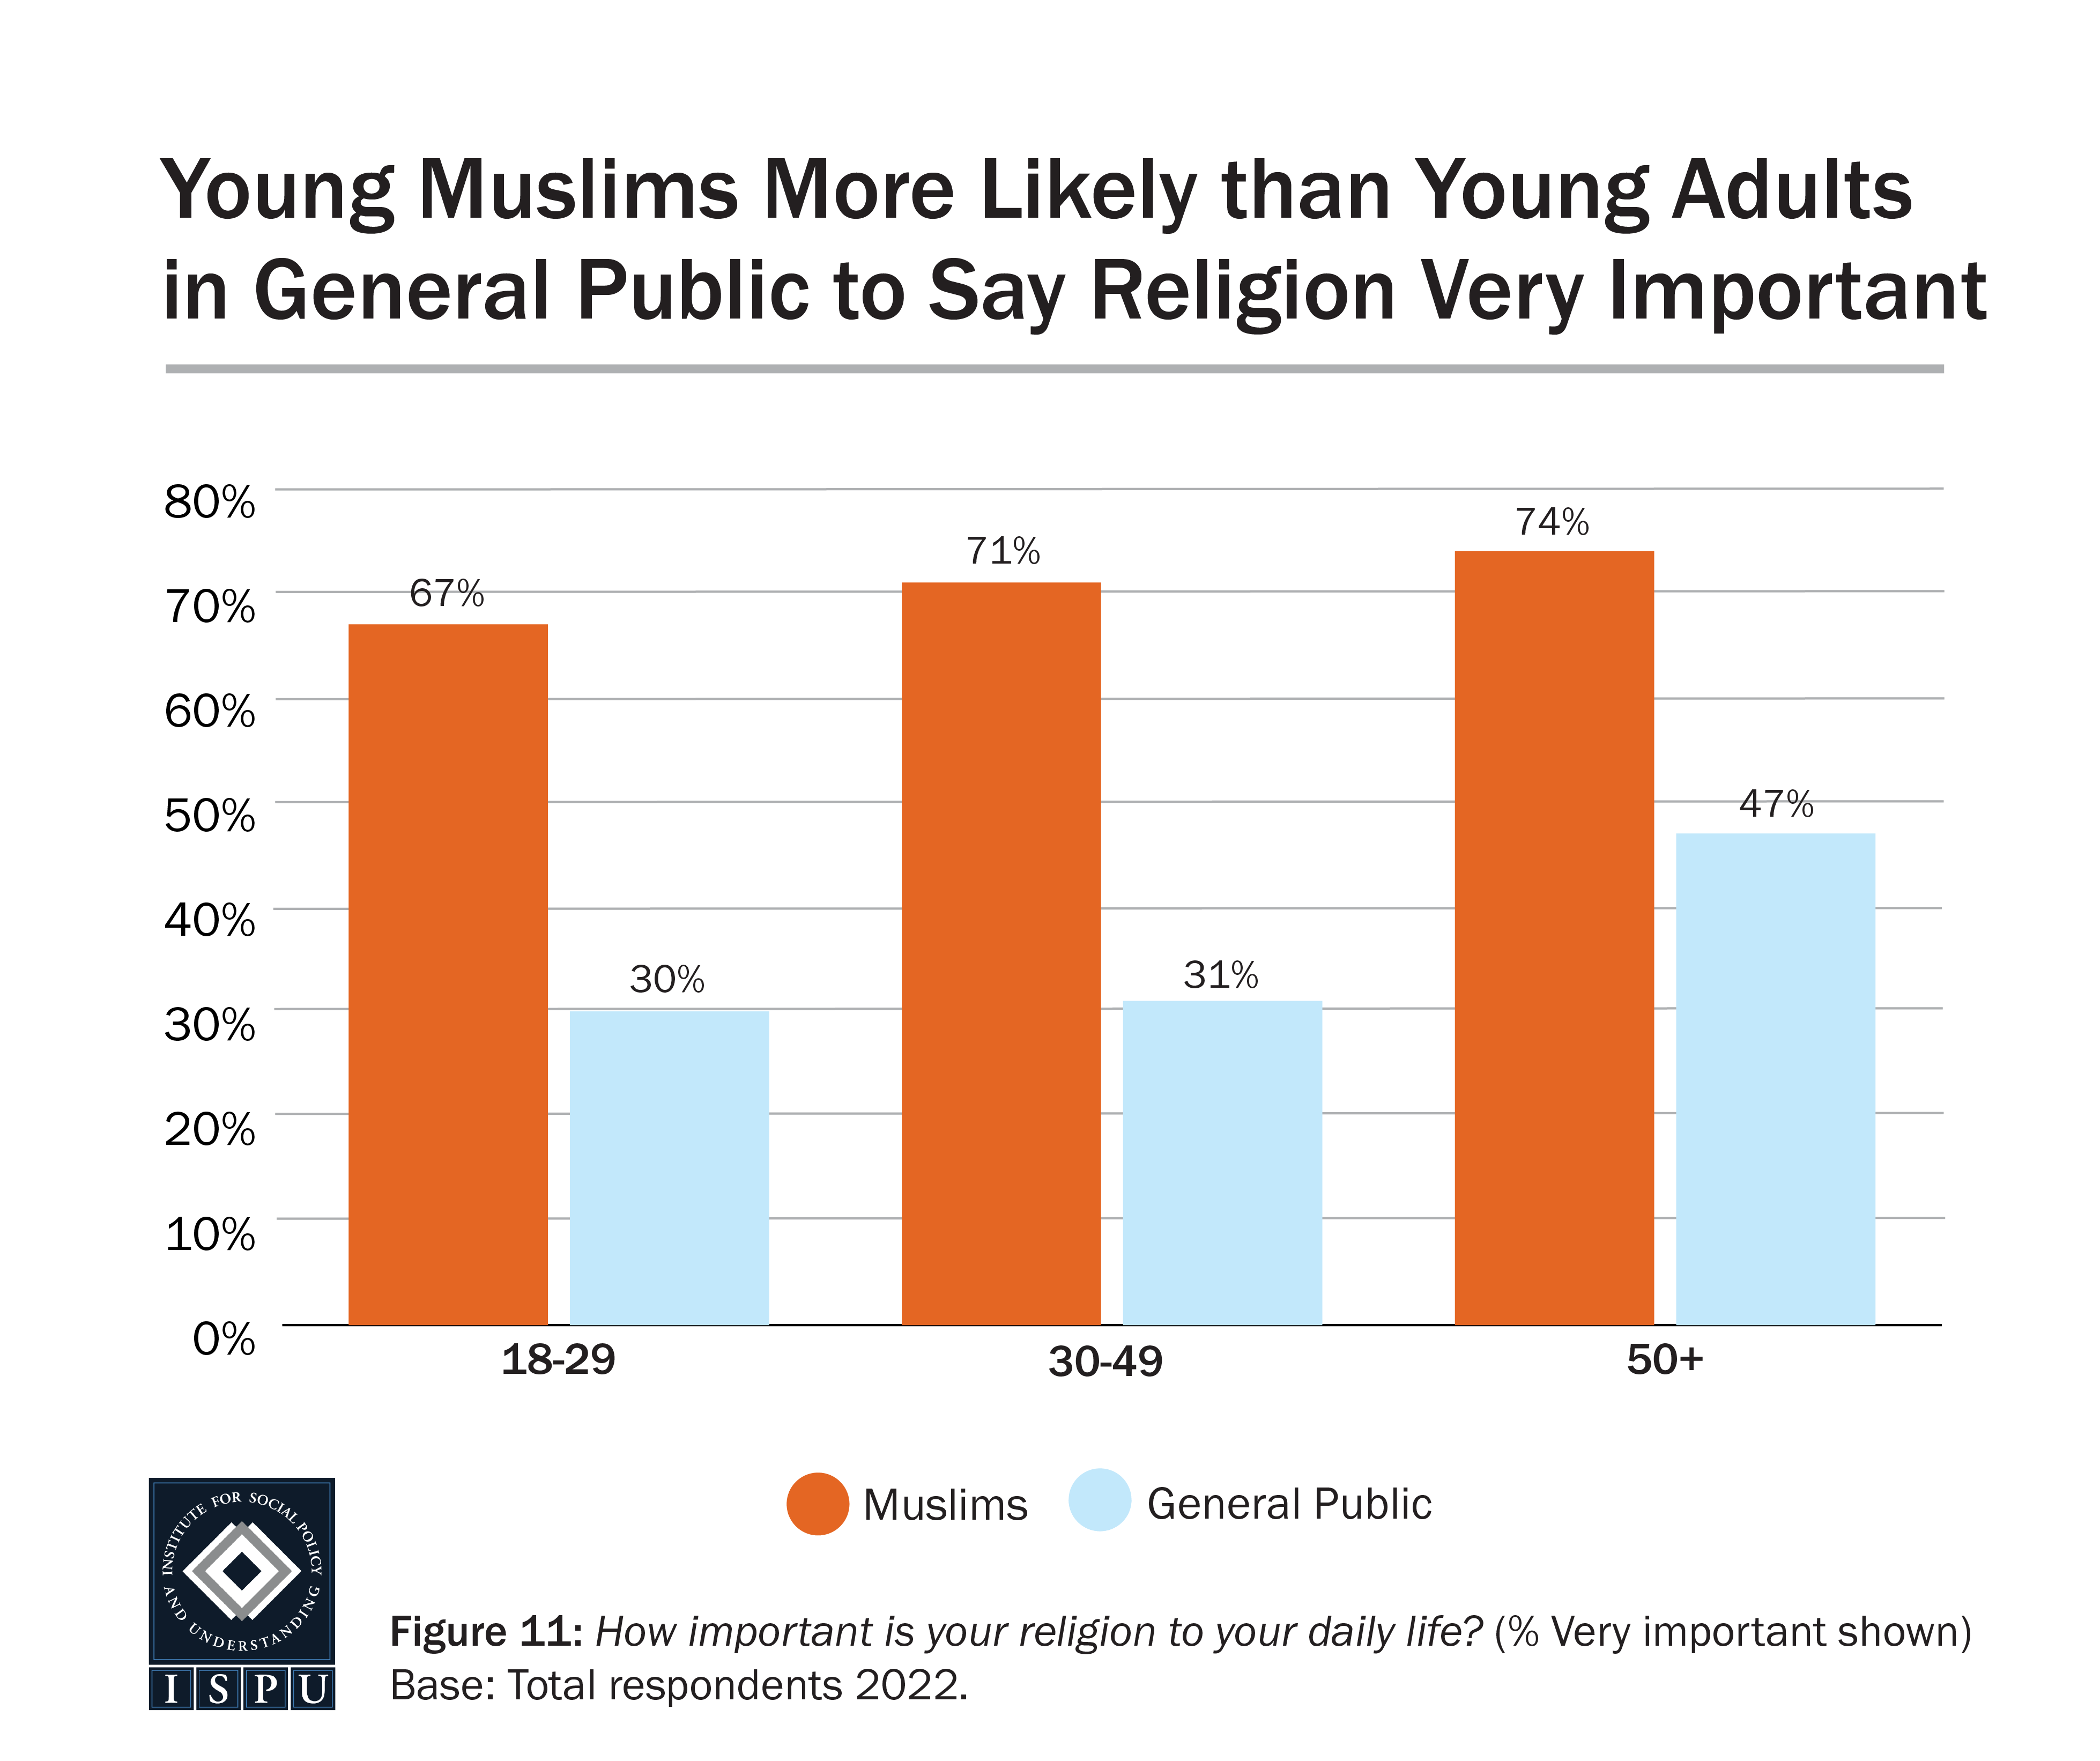
Young Muslims as Likely as Older Muslims to Say Religion is Very Important
Muslims of all ages were equally likely to rate religion as ‘very important’ to their daily life (67% of 18-29-year-olds, 71% of 30-49-year-olds, and 74% of 50+-year-olds). However, among the general public, the oldest were more likely than the younger age groups to say religion is ‘very important’ (47% of 50+-year-olds vs. 30% of 18-29-year-olds and 31% of 30-49-year-olds). Additionally, Muslims in all three age groups are more likely than their age counterparts in the general public to rate religion as ‘very important.’ The absence of an age differential in the Muslim community suggests that devotion to faith will endure in the next generation, bucking the trend in the wider mainstream.
Muslims in all three age groups are more likely than their age counterparts in the general public to rate religion as ‘very important.’
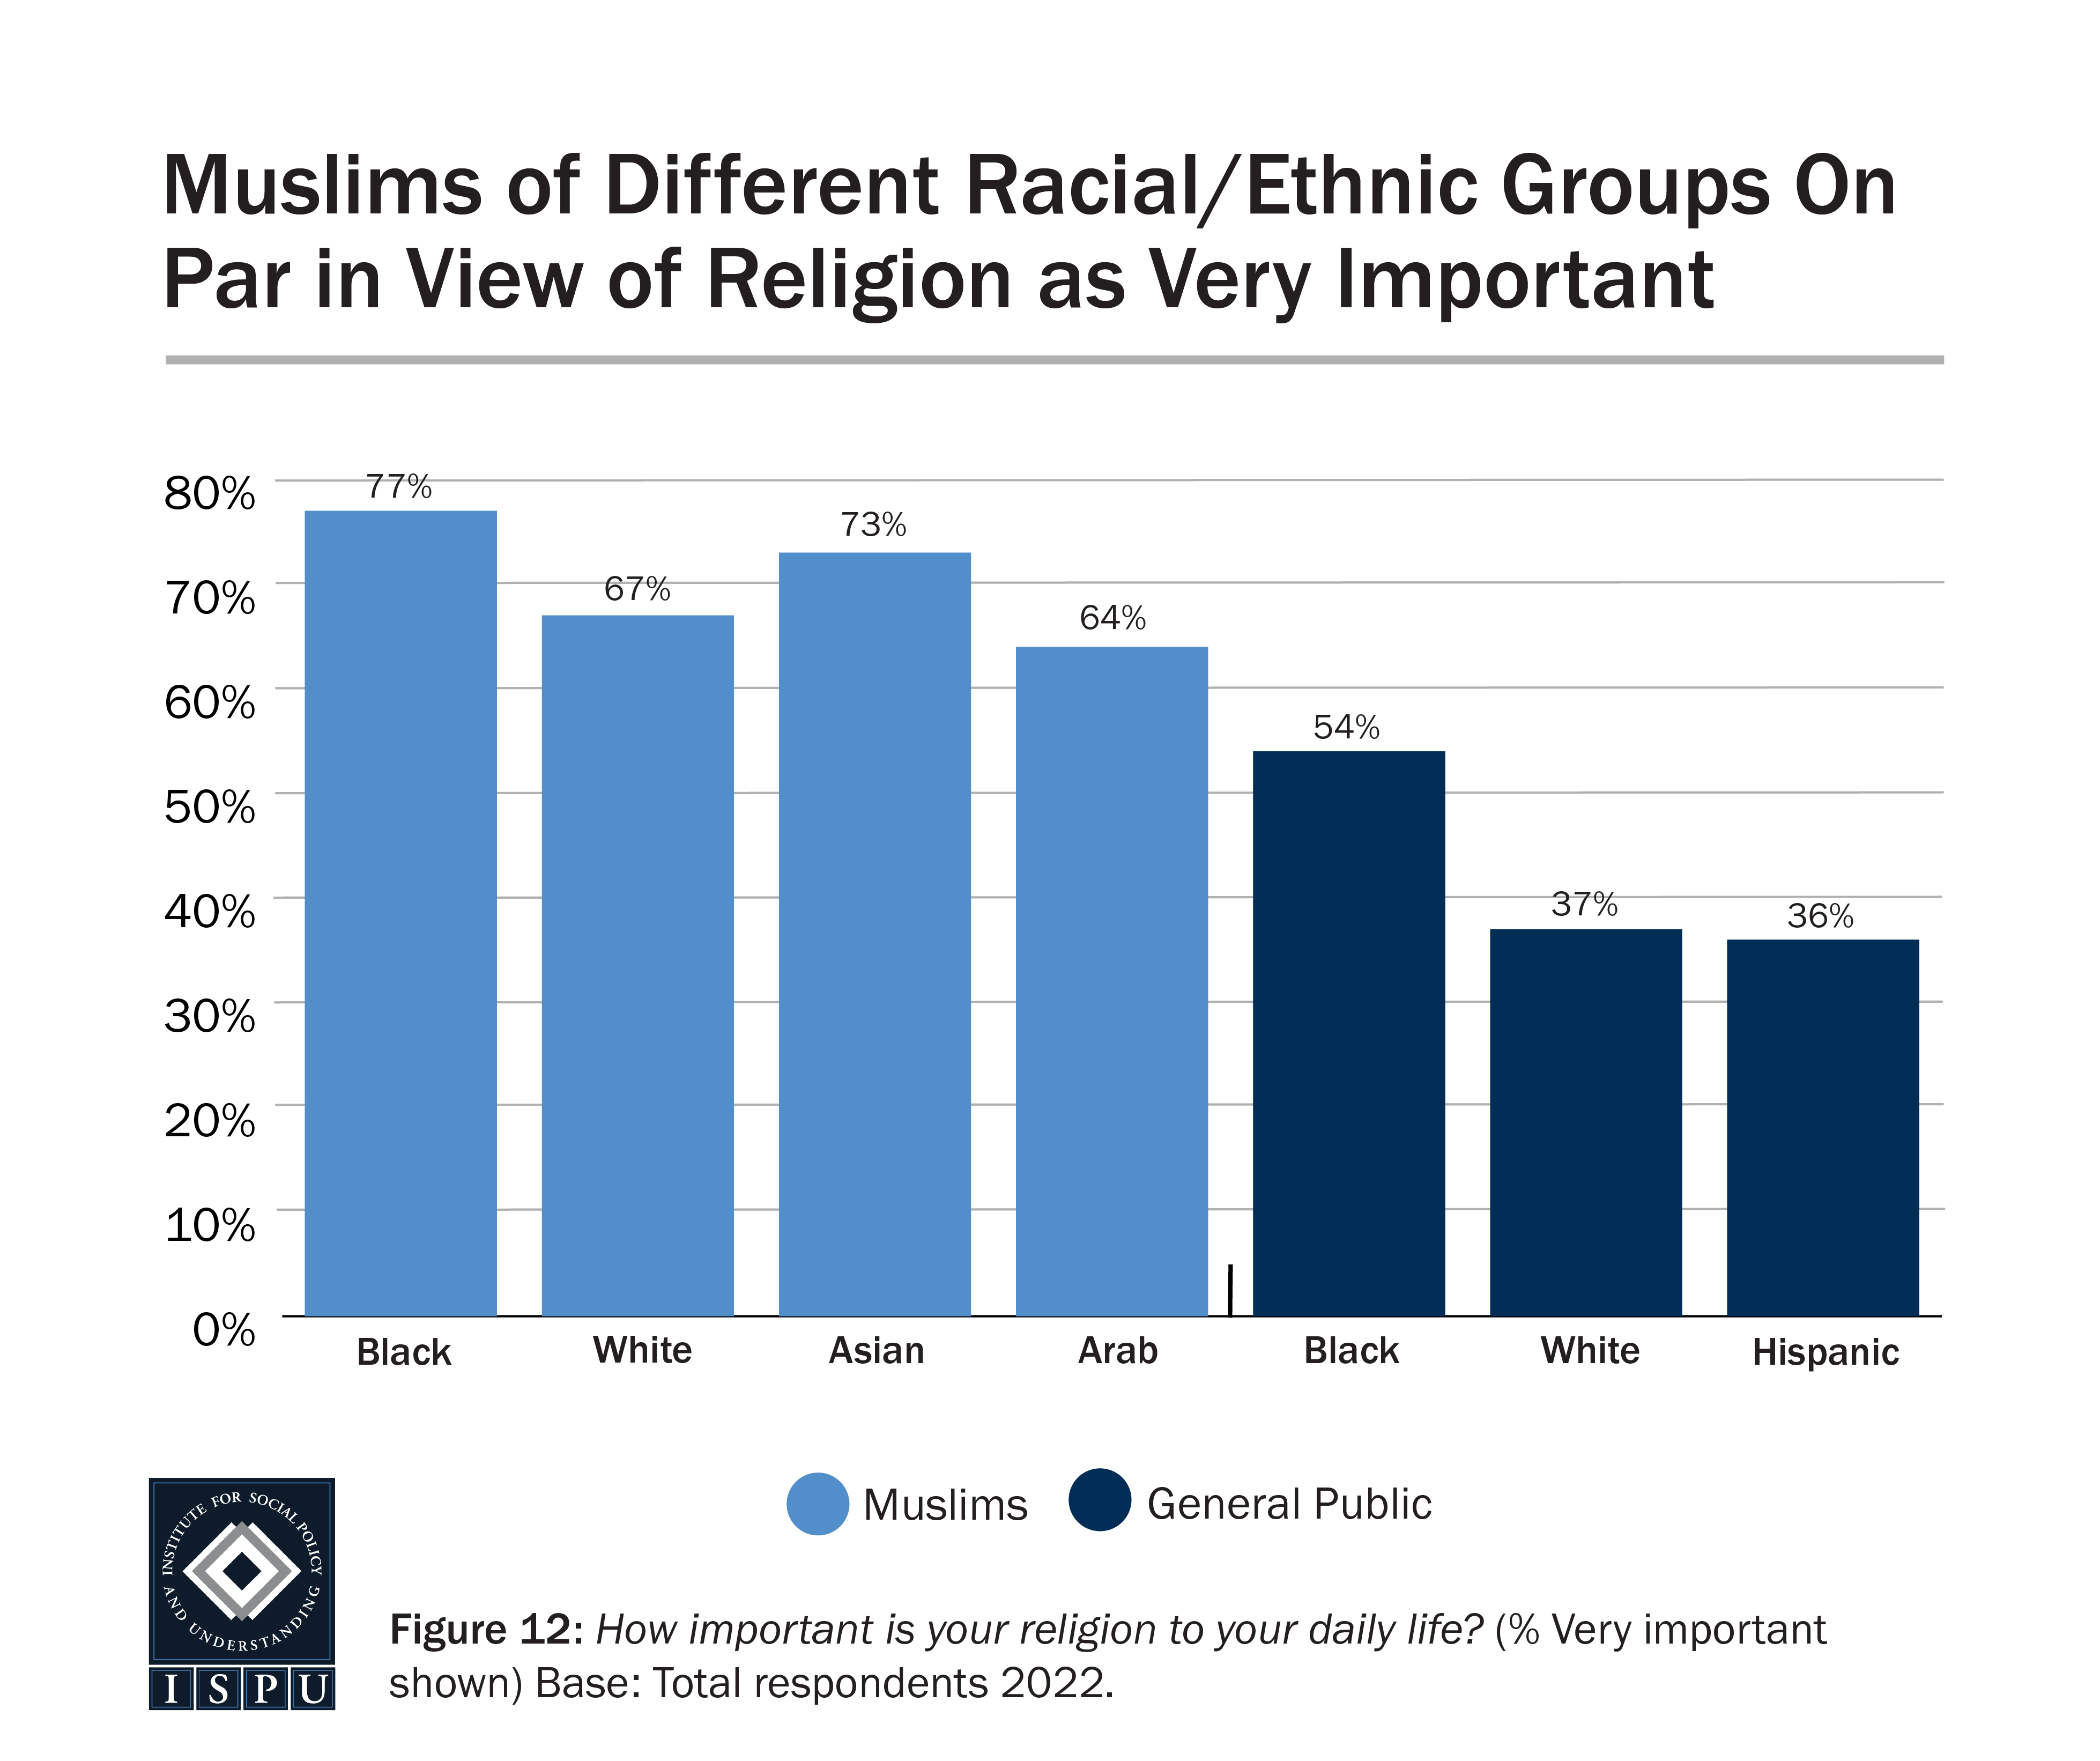
Muslims of Different Racial/Ethnic Groups Equally Likely to Say Religion Is Very Important
American Muslims of different races and ethnicities were also equally likely to say religion is ‘very important’ to their daily life (77% of Black Muslims, 67% of white Muslims, 73% of Asian Muslims, and 64% of Arab Muslims). Among the general public, Black Americans (54%) are the most likely to rate religion as ‘very important,’ compared with whites (37%) and Hispanics (36%). Black and white Muslims are more likely than Black and white Americans to say religion is ‘very important.’ As diverse as the American Muslim community is across racial, socio-economic, and even ideological political lines, it is noteworthy that devotion to faith is a common denominator.
Roughly Four in Ten American Muslims Attend Religious Services on a Weekly Basis or More
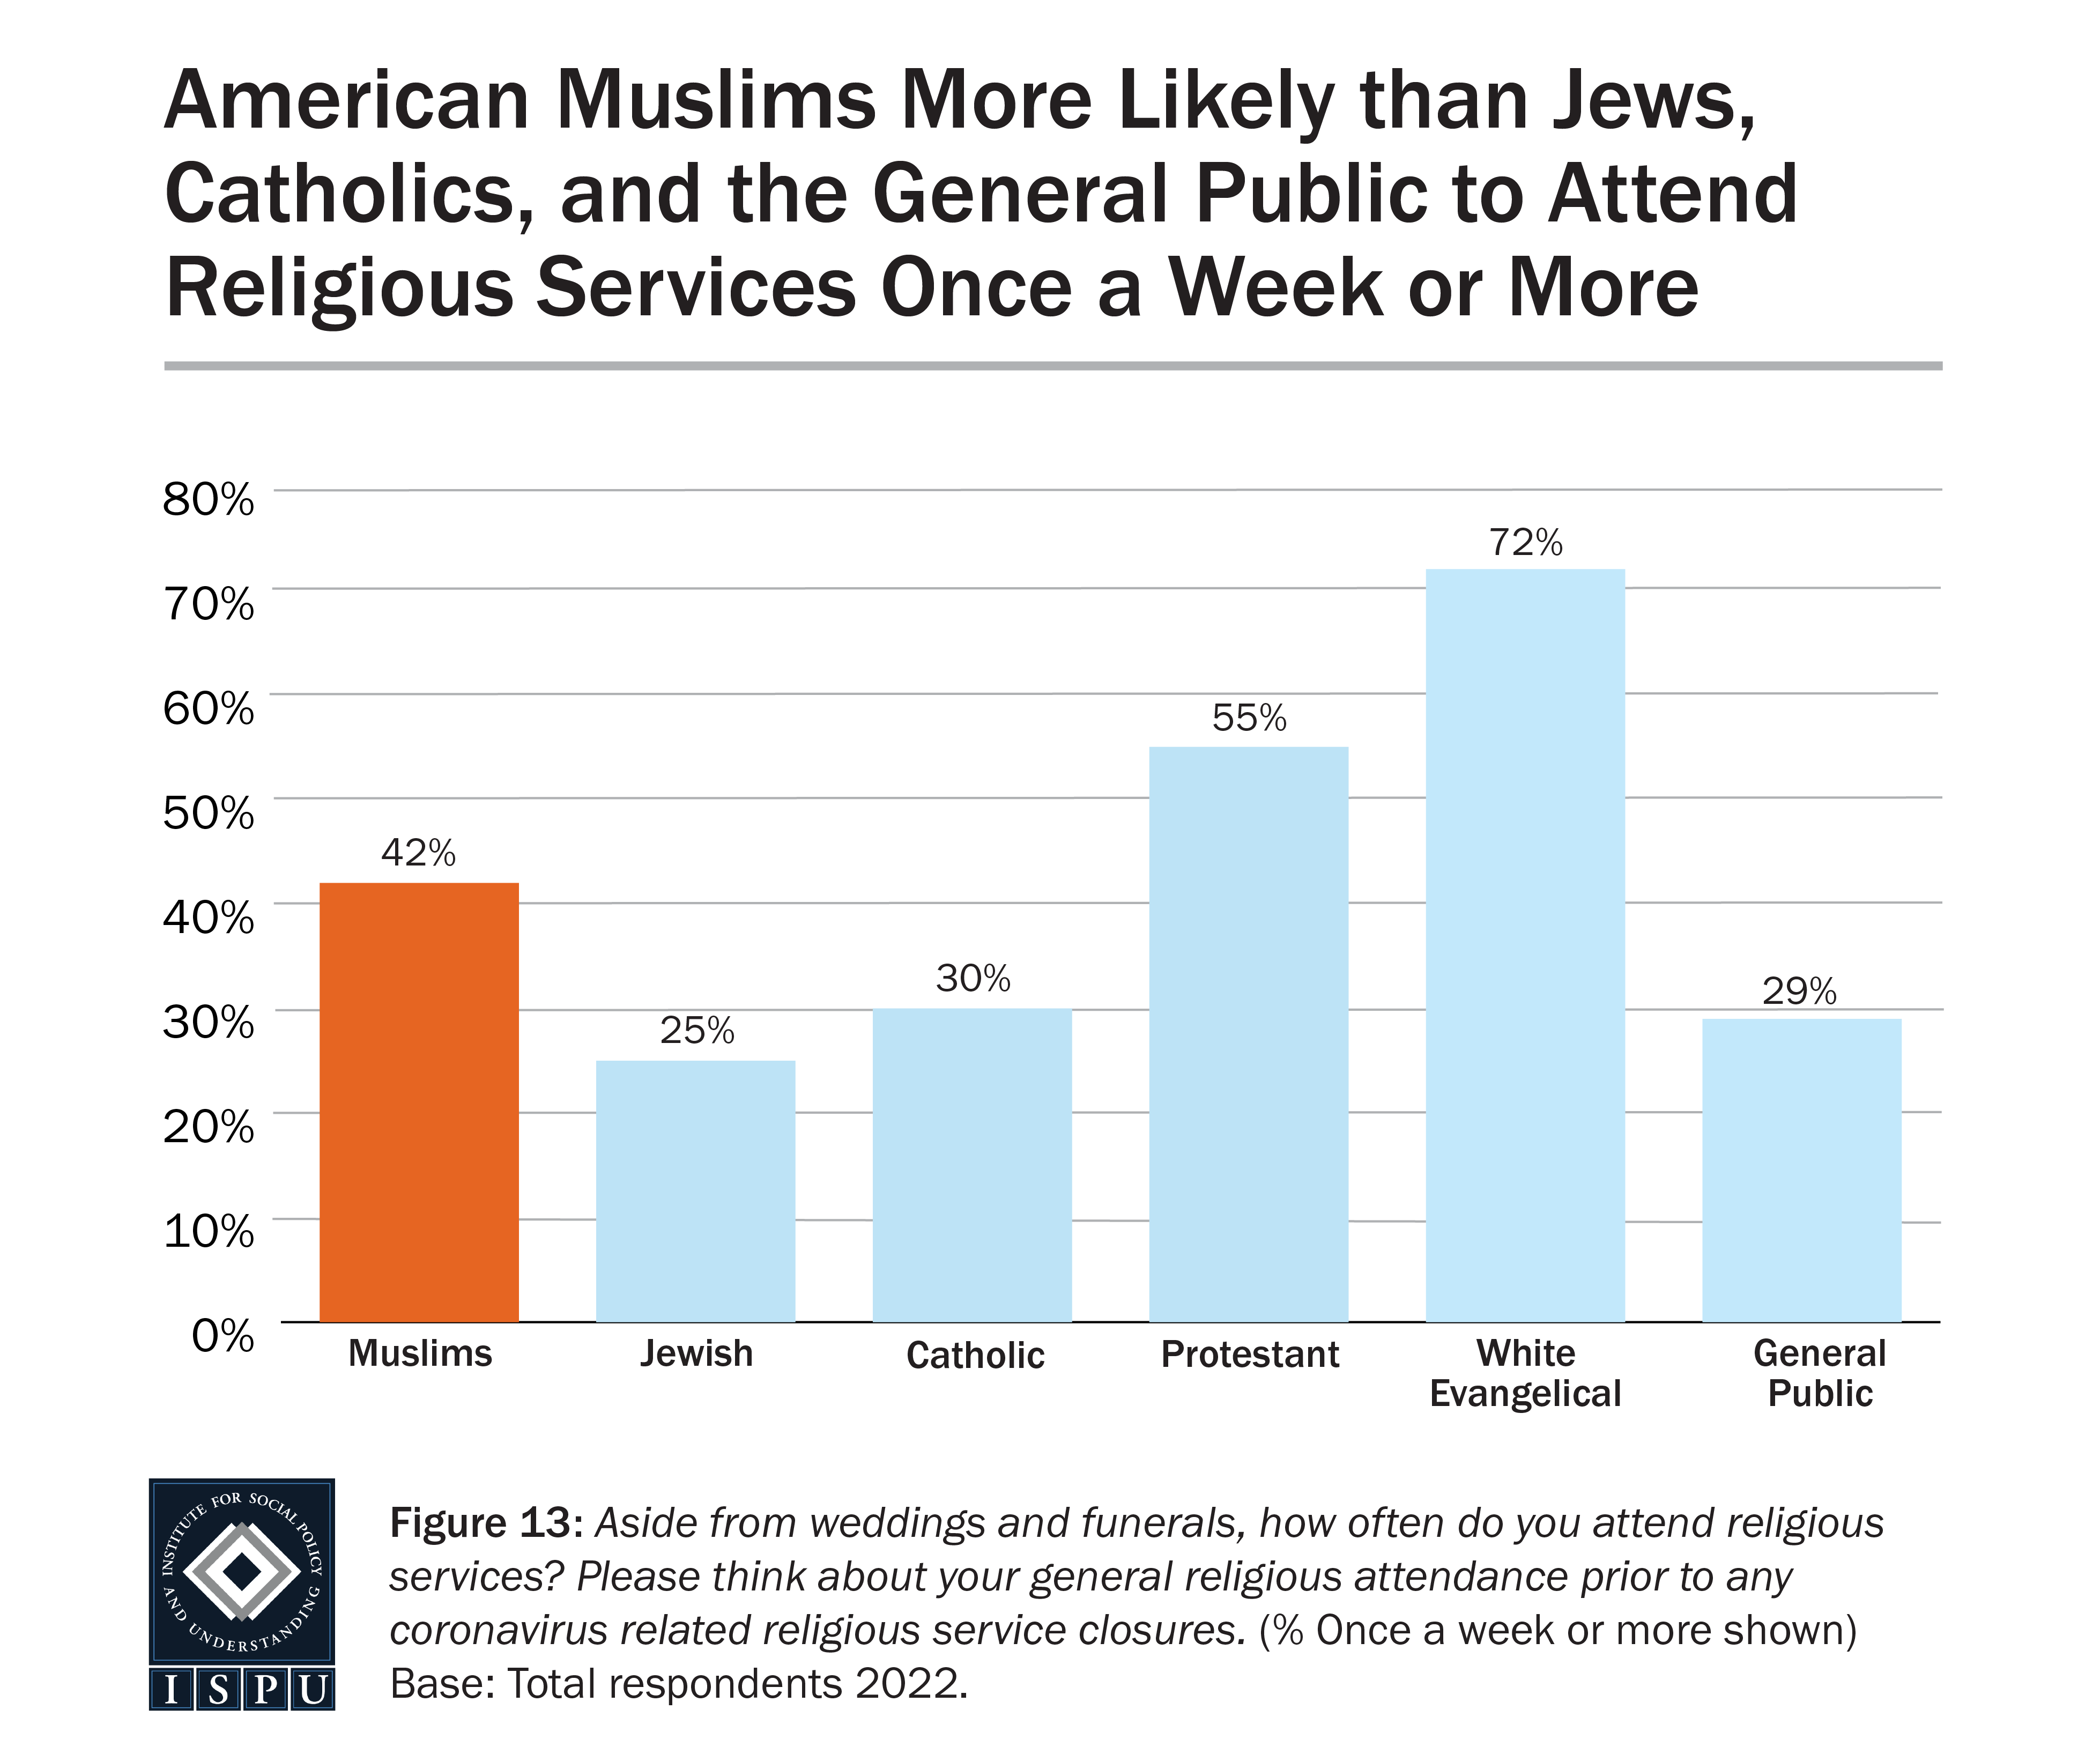
As has consistently been the case in previous ISPU polls, 42% of American Muslims report attending a religious service once a week or more. This is less than Protestants (55%) and white Evangelicals (72%), and more than Jews (25%), Catholics (30%), and the general public (29%). Muslim men are more likely than Muslim women to attend religious services on at least a weekly basis (53% among men and 27% among women), likely explained by the fact that traditional Islamic teachings require men to attend Friday congregational prayer and make it optional for women.
While young Muslims aged 18-29 are less likely than older Muslims to attend religious services once a week or more (30% vs. 50% of 30-49-year-olds and 46% of 50+-year-olds), they are more likely than young people in the general public (30% vs. 16%, respectively) to do so. This is in line with findings from the 2020 Mosque Survey. Among Muslims, there are no differences in frequency of mosque attendance by race and ethnicity.
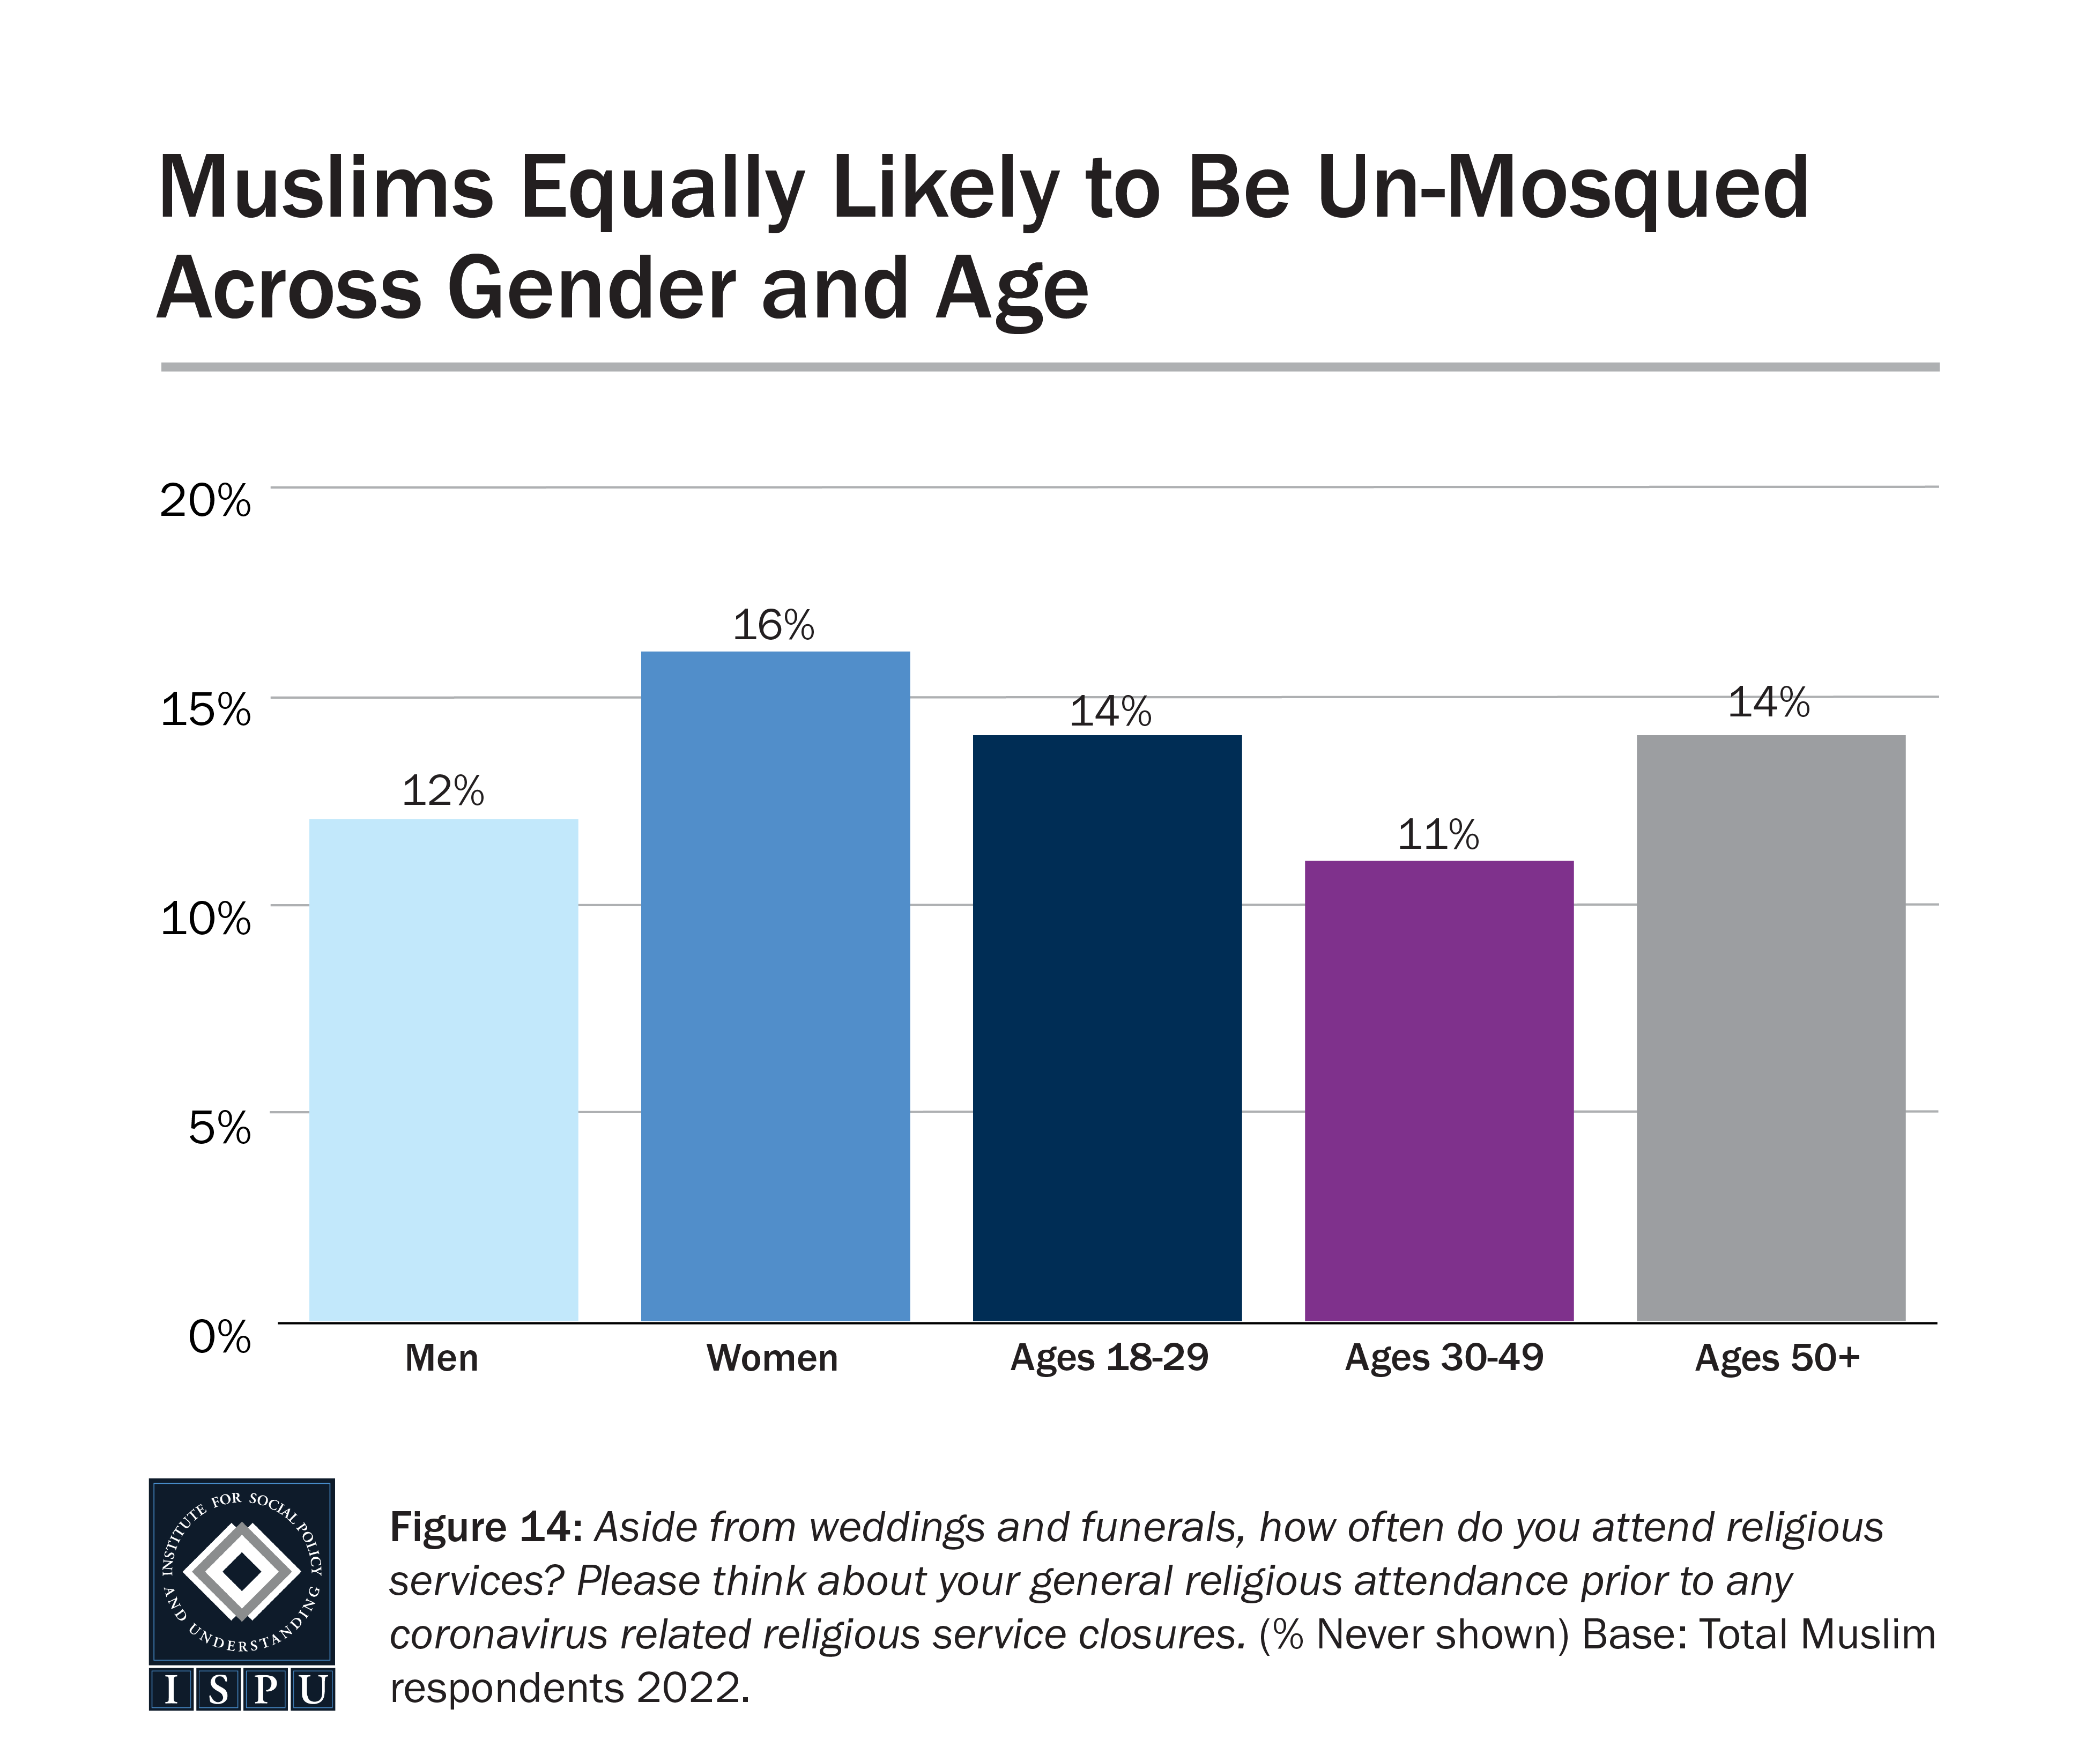
On the flip side, only 14% of Muslims say they never go to the mosque (the so-called “un-mosqued”). Muslim men (12%) are as likely as Muslim women (16%) to be un-mosqued, as are Muslims of all ages (14% of 18-29-year-olds, 11% of 30-49-year-olds, and 14% of those 50+ years old).


