.
American Muslim Poll 2022:
A Politics and Pandemic Status Report
AUGUST 25, 2022 | BY DALIA MOGAHED, ERUM IKRAMULLAH, AND YOUSSEF CHOUHOUD
.
PART II: POLLS AND POLITICS: Optimistic and Increasingly Engaged Despite Obstacles
The last American Muslim Poll was fielded in 2020, in the last year of the Trump administration. With President Biden now having been in office for over a year, and in the beginning of a midterm election year, in this year’s poll we sought to learn what, if anything, has changed in terms of American Muslim civic engagement. New in 2022, we polled American Muslims, as well as Americans of other faith and non-faith groups, about their experiences with possible obstacles to voting, along with their views on a number of hot-button issues of importance to voters.

DOWNLOADS
.
Satisfaction with the Direction of the Country
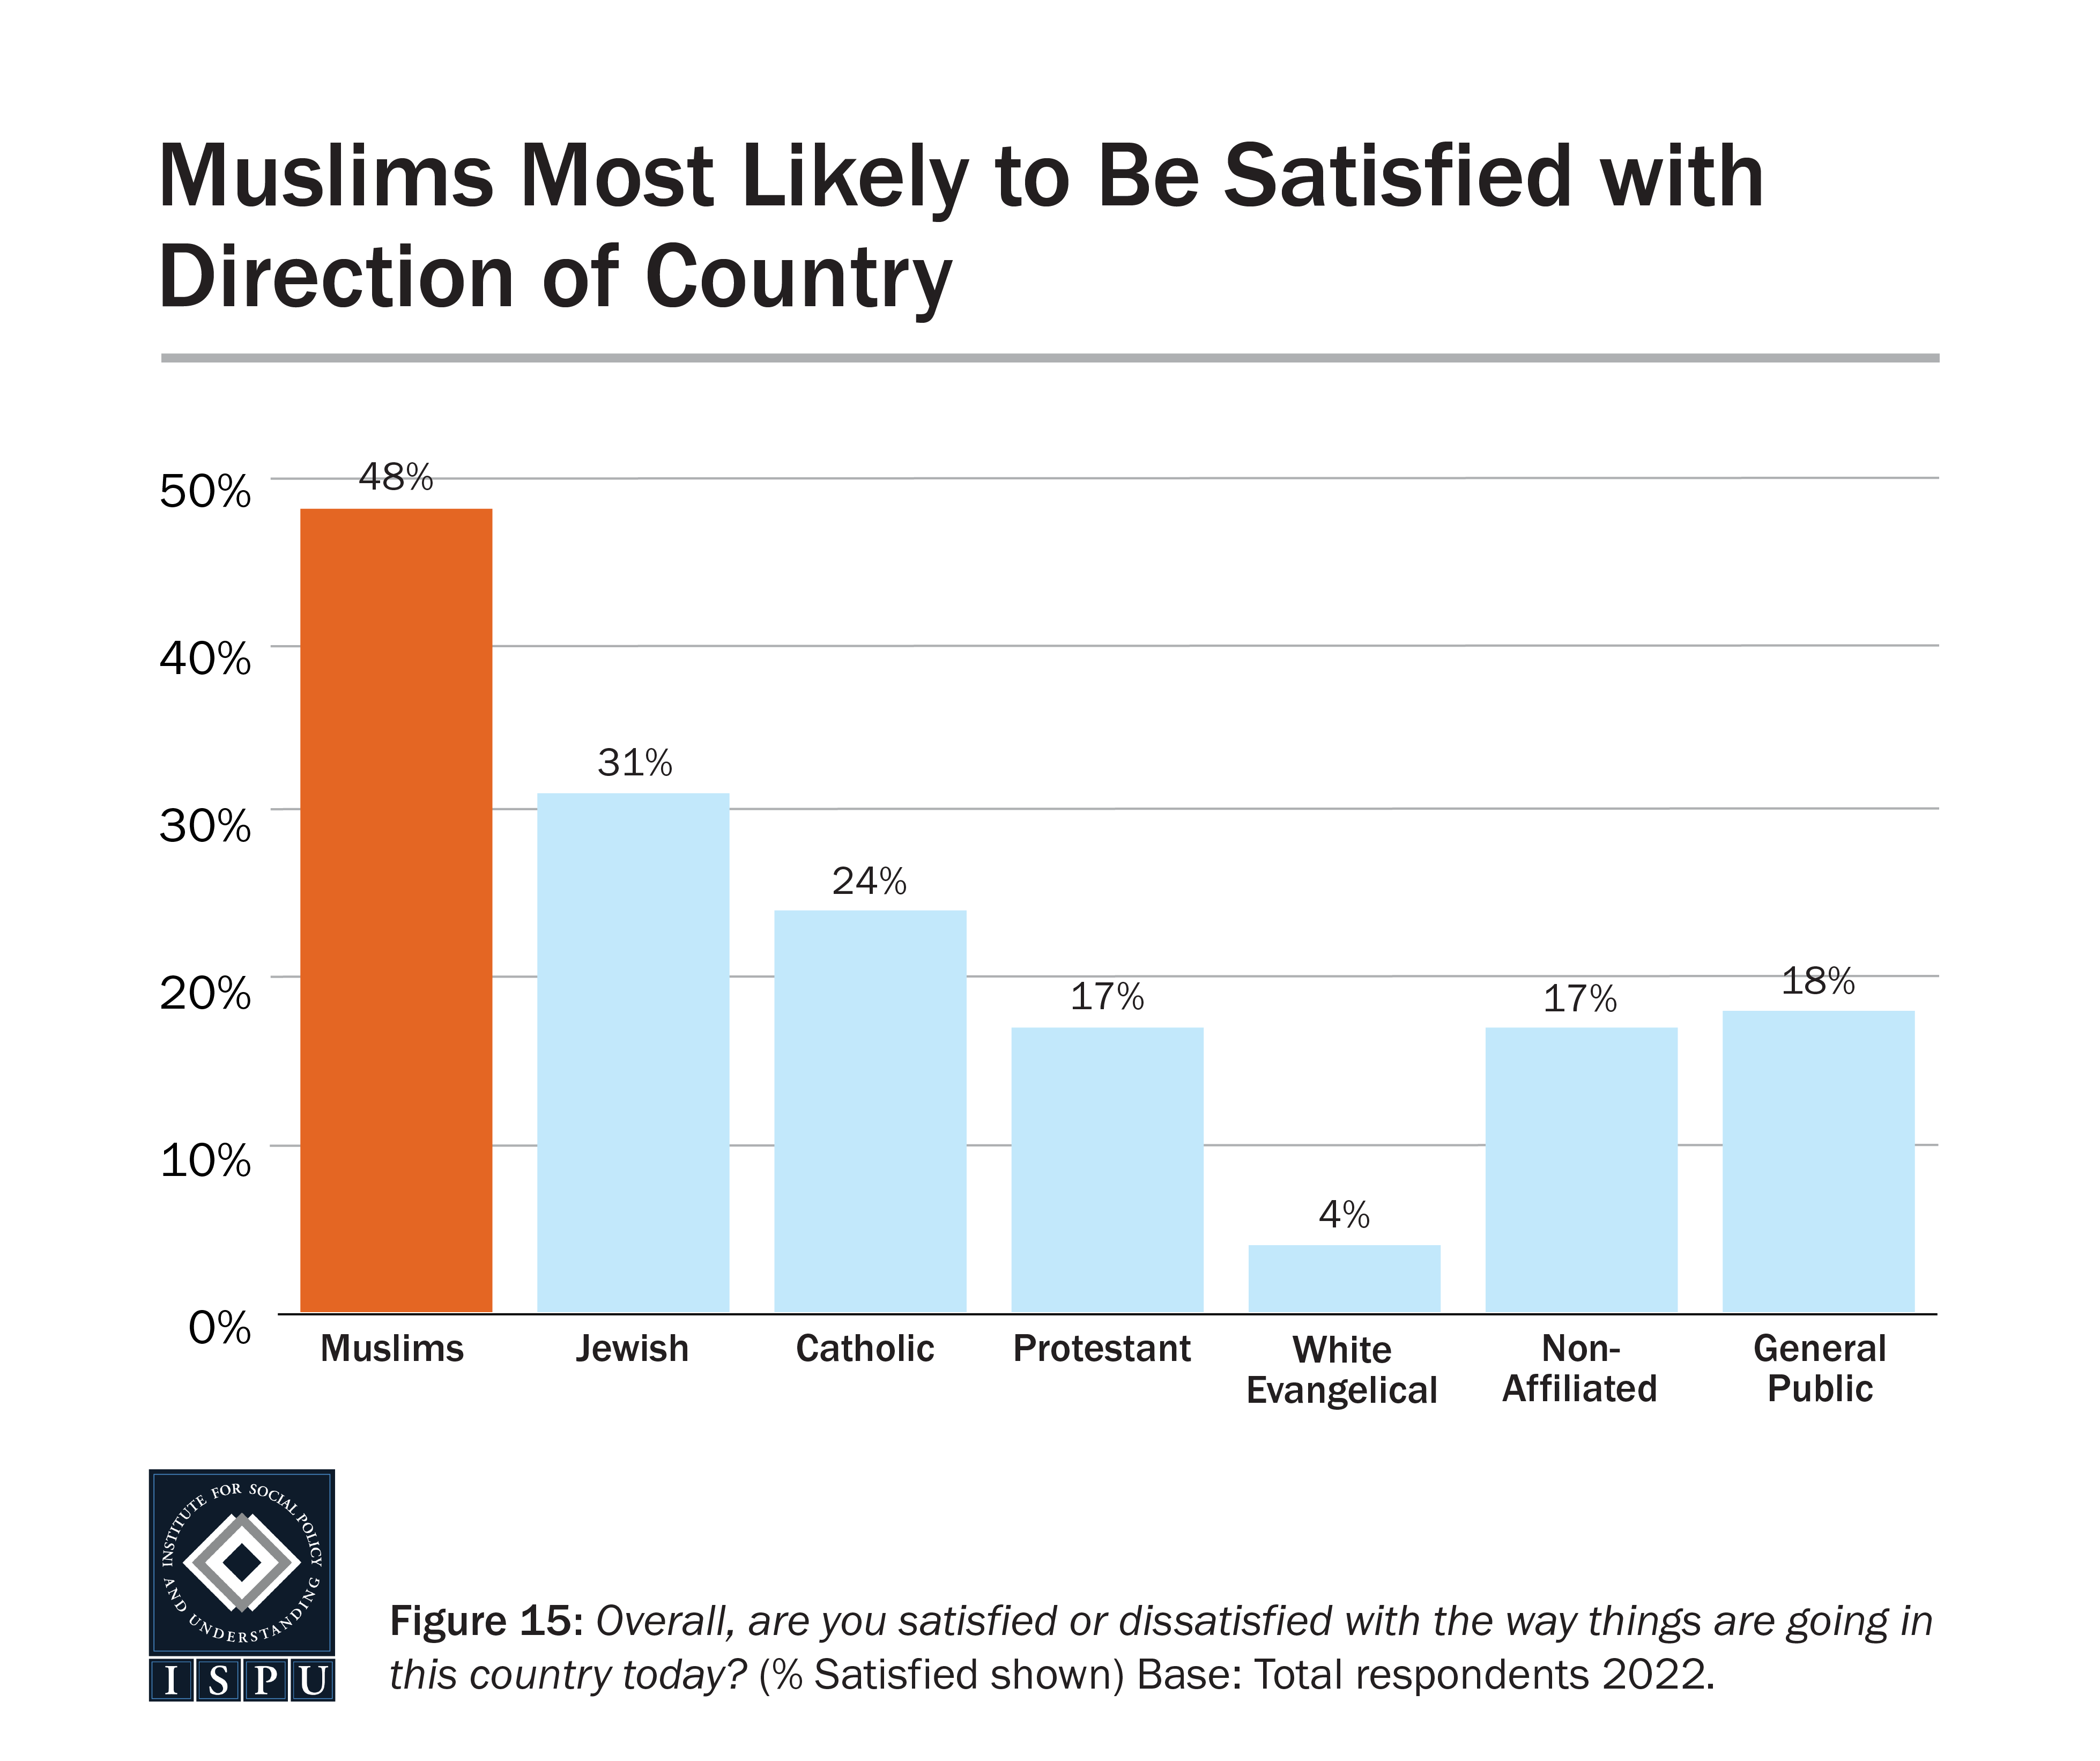
American Muslims Remain the Most Optimistic about the Direction of the Country
In 2022, as in previous years, American Muslims are the most optimistic about the direction of the country, compared with all other groups surveyed (48% among Muslims vs. 31% of Jews, 24% of Catholics, 17% of Protestants, 4% of white Evangelicals, 17% of the nonaffiliated, and 18% of the general public). On the other hand, nearly all white Evangelicals (95%) report dissatisfaction with the direction of the country, which is more likely than all other groups surveyed. Given that in 2020, 56% of white Evangelicals were dissatisfied, perhaps so many more express dissatisfaction in 2022 because of the Democratic victory in the 2020 election, as most white Evangelicals identify as Republicans (69%).
In 2022, as in previous years, American Muslims are the most optimistic about the direction of the country, compared with all other groups surveyed.
In 2022, among nearly all faith and non-faith groups, we found no gender differences on satisfaction with the direction of the country. This suggests political views are more aligned by faith than by gender. The one exception is Protestants, among whom men are more likely than women to report satisfaction with the direction of the country (24% vs. 13%).
Did You Know?
ISPU’s survey of American Muslims, Jews, Catholics, Protestants, and the non-affiliated is one of a kind, offering the latest trends and demographic data on American Muslims. And every year, we rely on individuals like you to keep this research free and accessible to all. Right now, we need your help to keep it that way, so that millions can remain informed on the topics that matter the most. If you value the reliable data our poll provides, consider making a donation—big or small—in support of ISPU’s American Muslim Poll. It only takes a minute. Thank you.
Satisfaction with the Direction of The Country Varies by Age and Racial/Ethnic Groups
Middle-Aged Muslims Most Satisfied with the Direction of the Country, Young Muslims Least
Among Muslims, more than half (54%) of those 30-49 years old were satisfied with the direction of the country, more so than 42% of 18-29-year-old Muslims. The oldest Muslims, aged 50+ years old, fell in-between the other age groups with 49% expressing satisfaction. There were no age differences in satisfaction with the direction of the country among the general public.
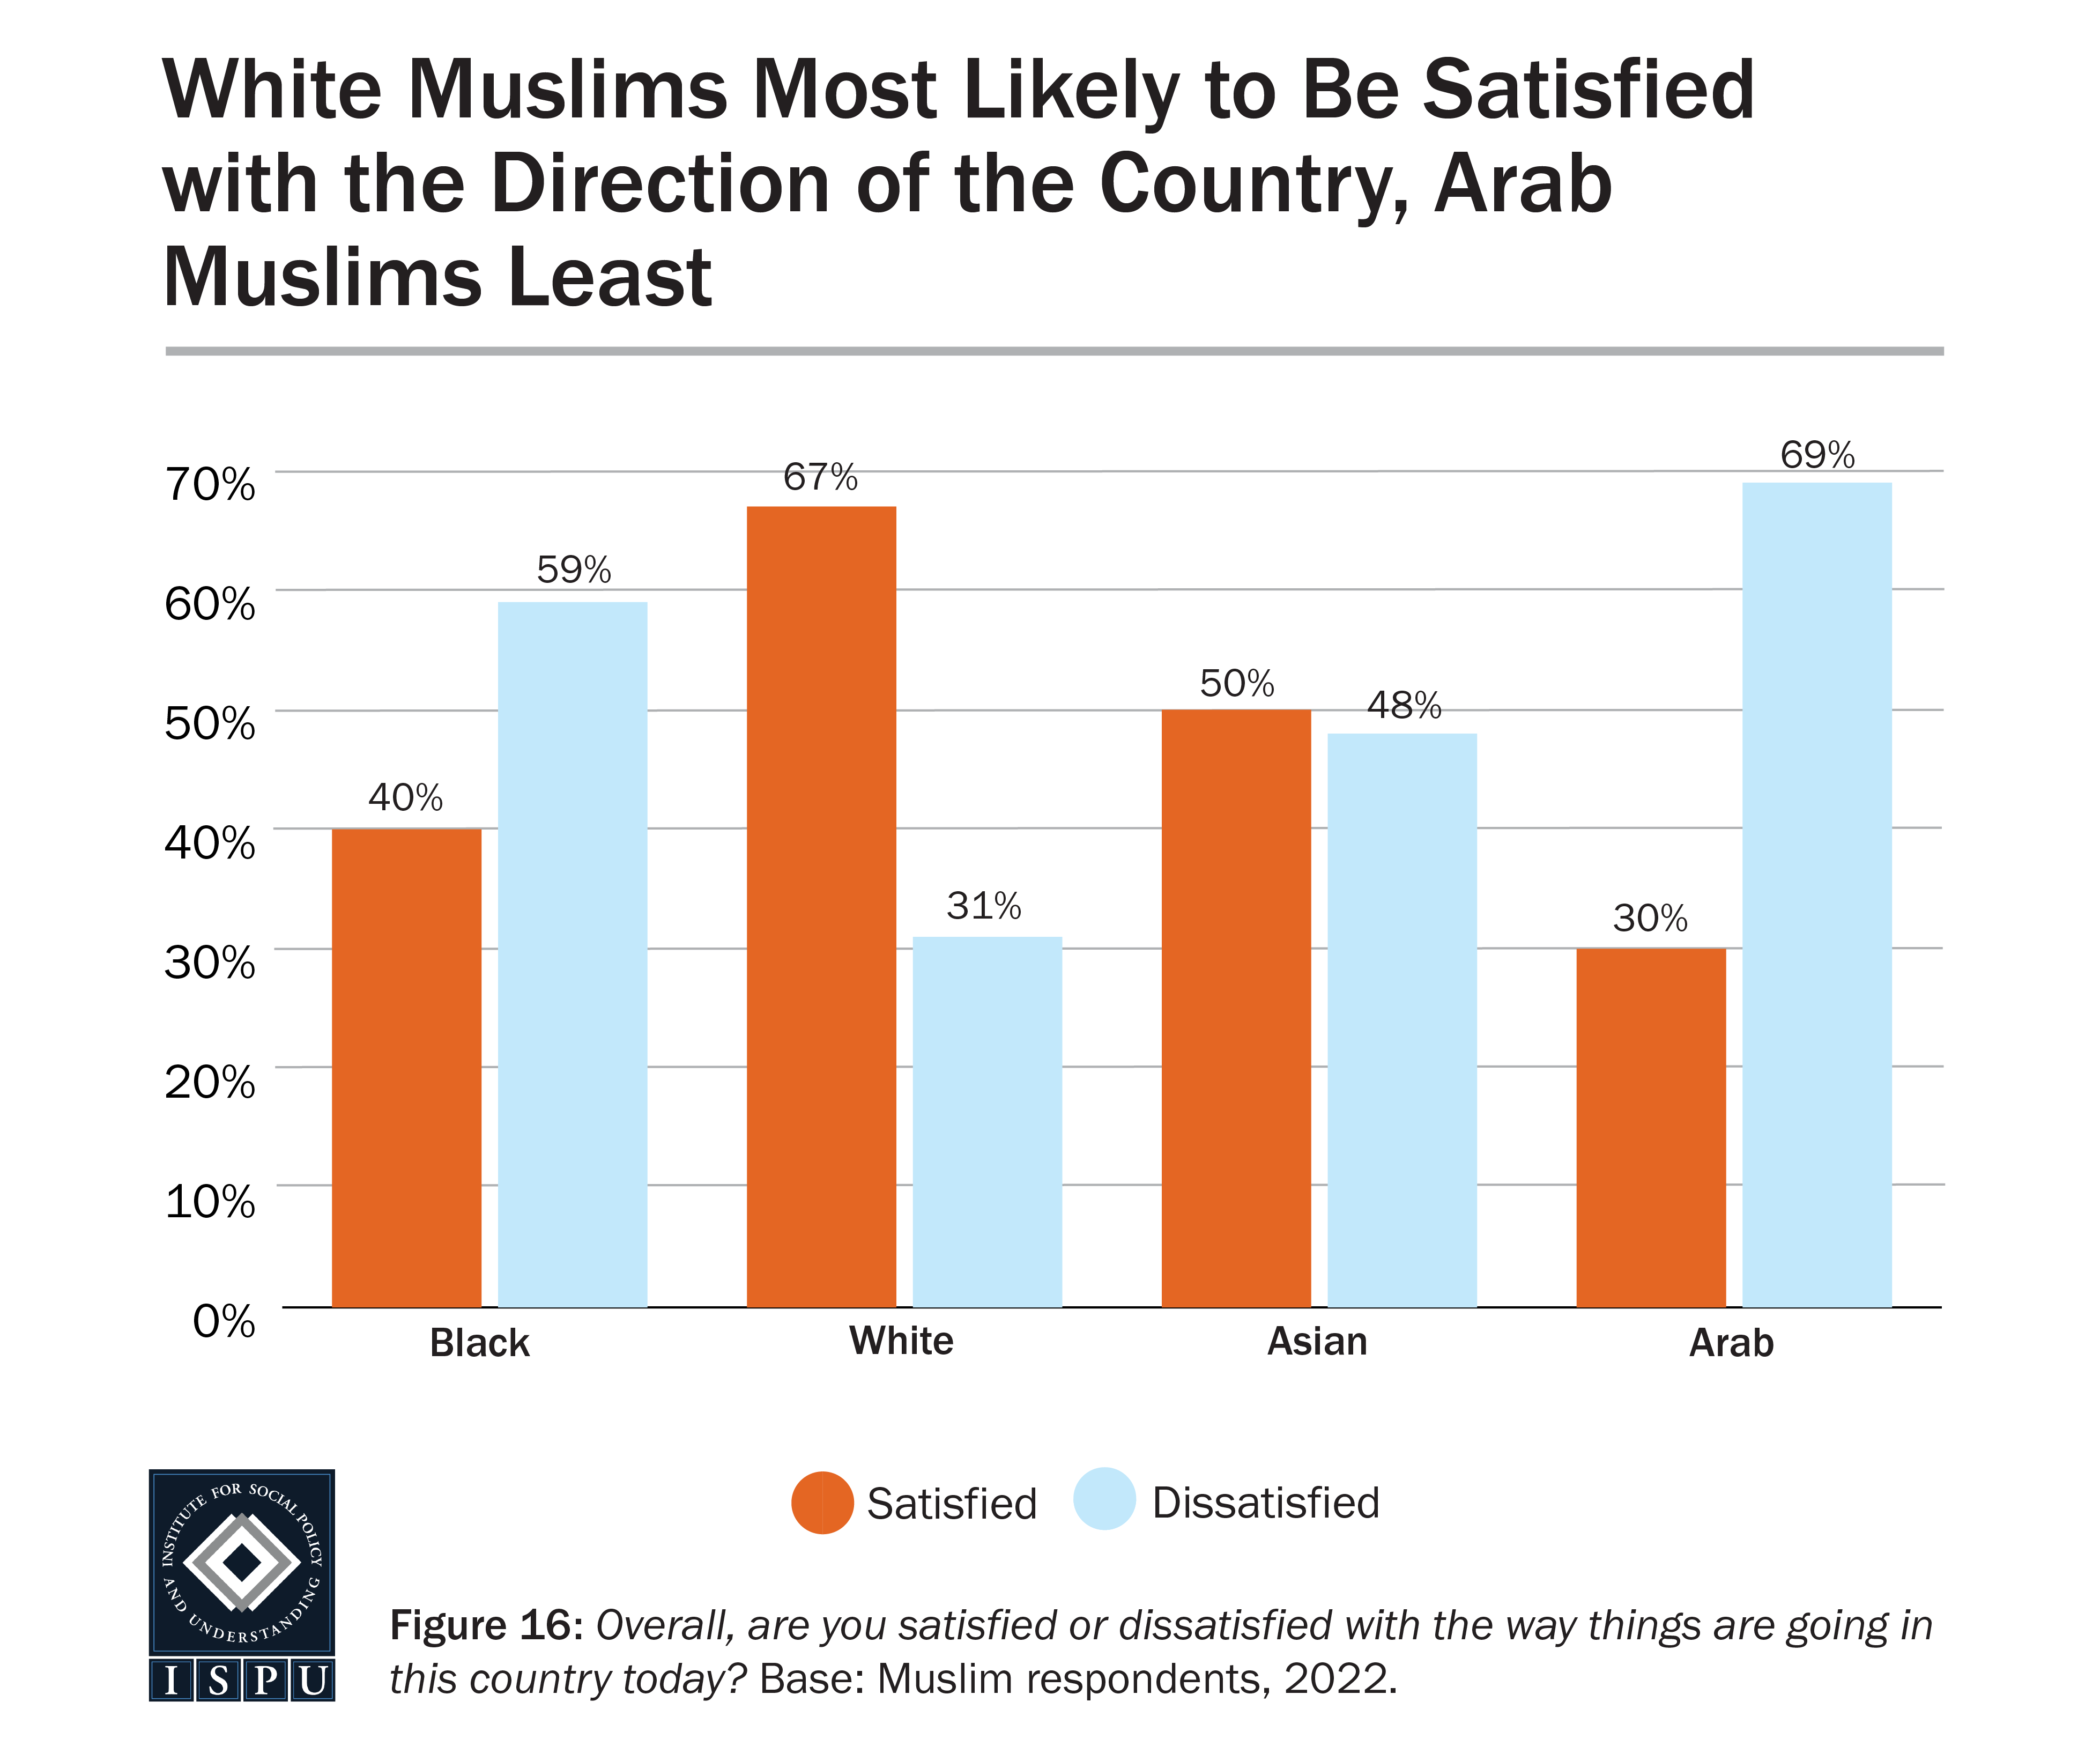
Arab Muslims Least Satisfied with the Direction of the Country
Looking at satisfaction with the direction of the country by race and ethnicity, we find differences among both Muslims and the general public. White Muslims were more likely than Black, Asian, and Arab Muslims to be satisfied with the direction of the country (67% vs. 40%, 50% and 30%, respectively). On the other end of the spectrum, Arab Muslims are more likely than Asian and white Muslims to report being dissatisfied with the direction of the country (69% of Arabs vs. 31% of whites and 48% of Asians). Black Muslims lie in-between, being more likely than white Muslims to be dissatisfied (59% vs. 31%). Among the general public, whites are less likely than Black and Hispanics to be satisfied (13% of whites vs. 26% of Black and 21% of Hispanics).
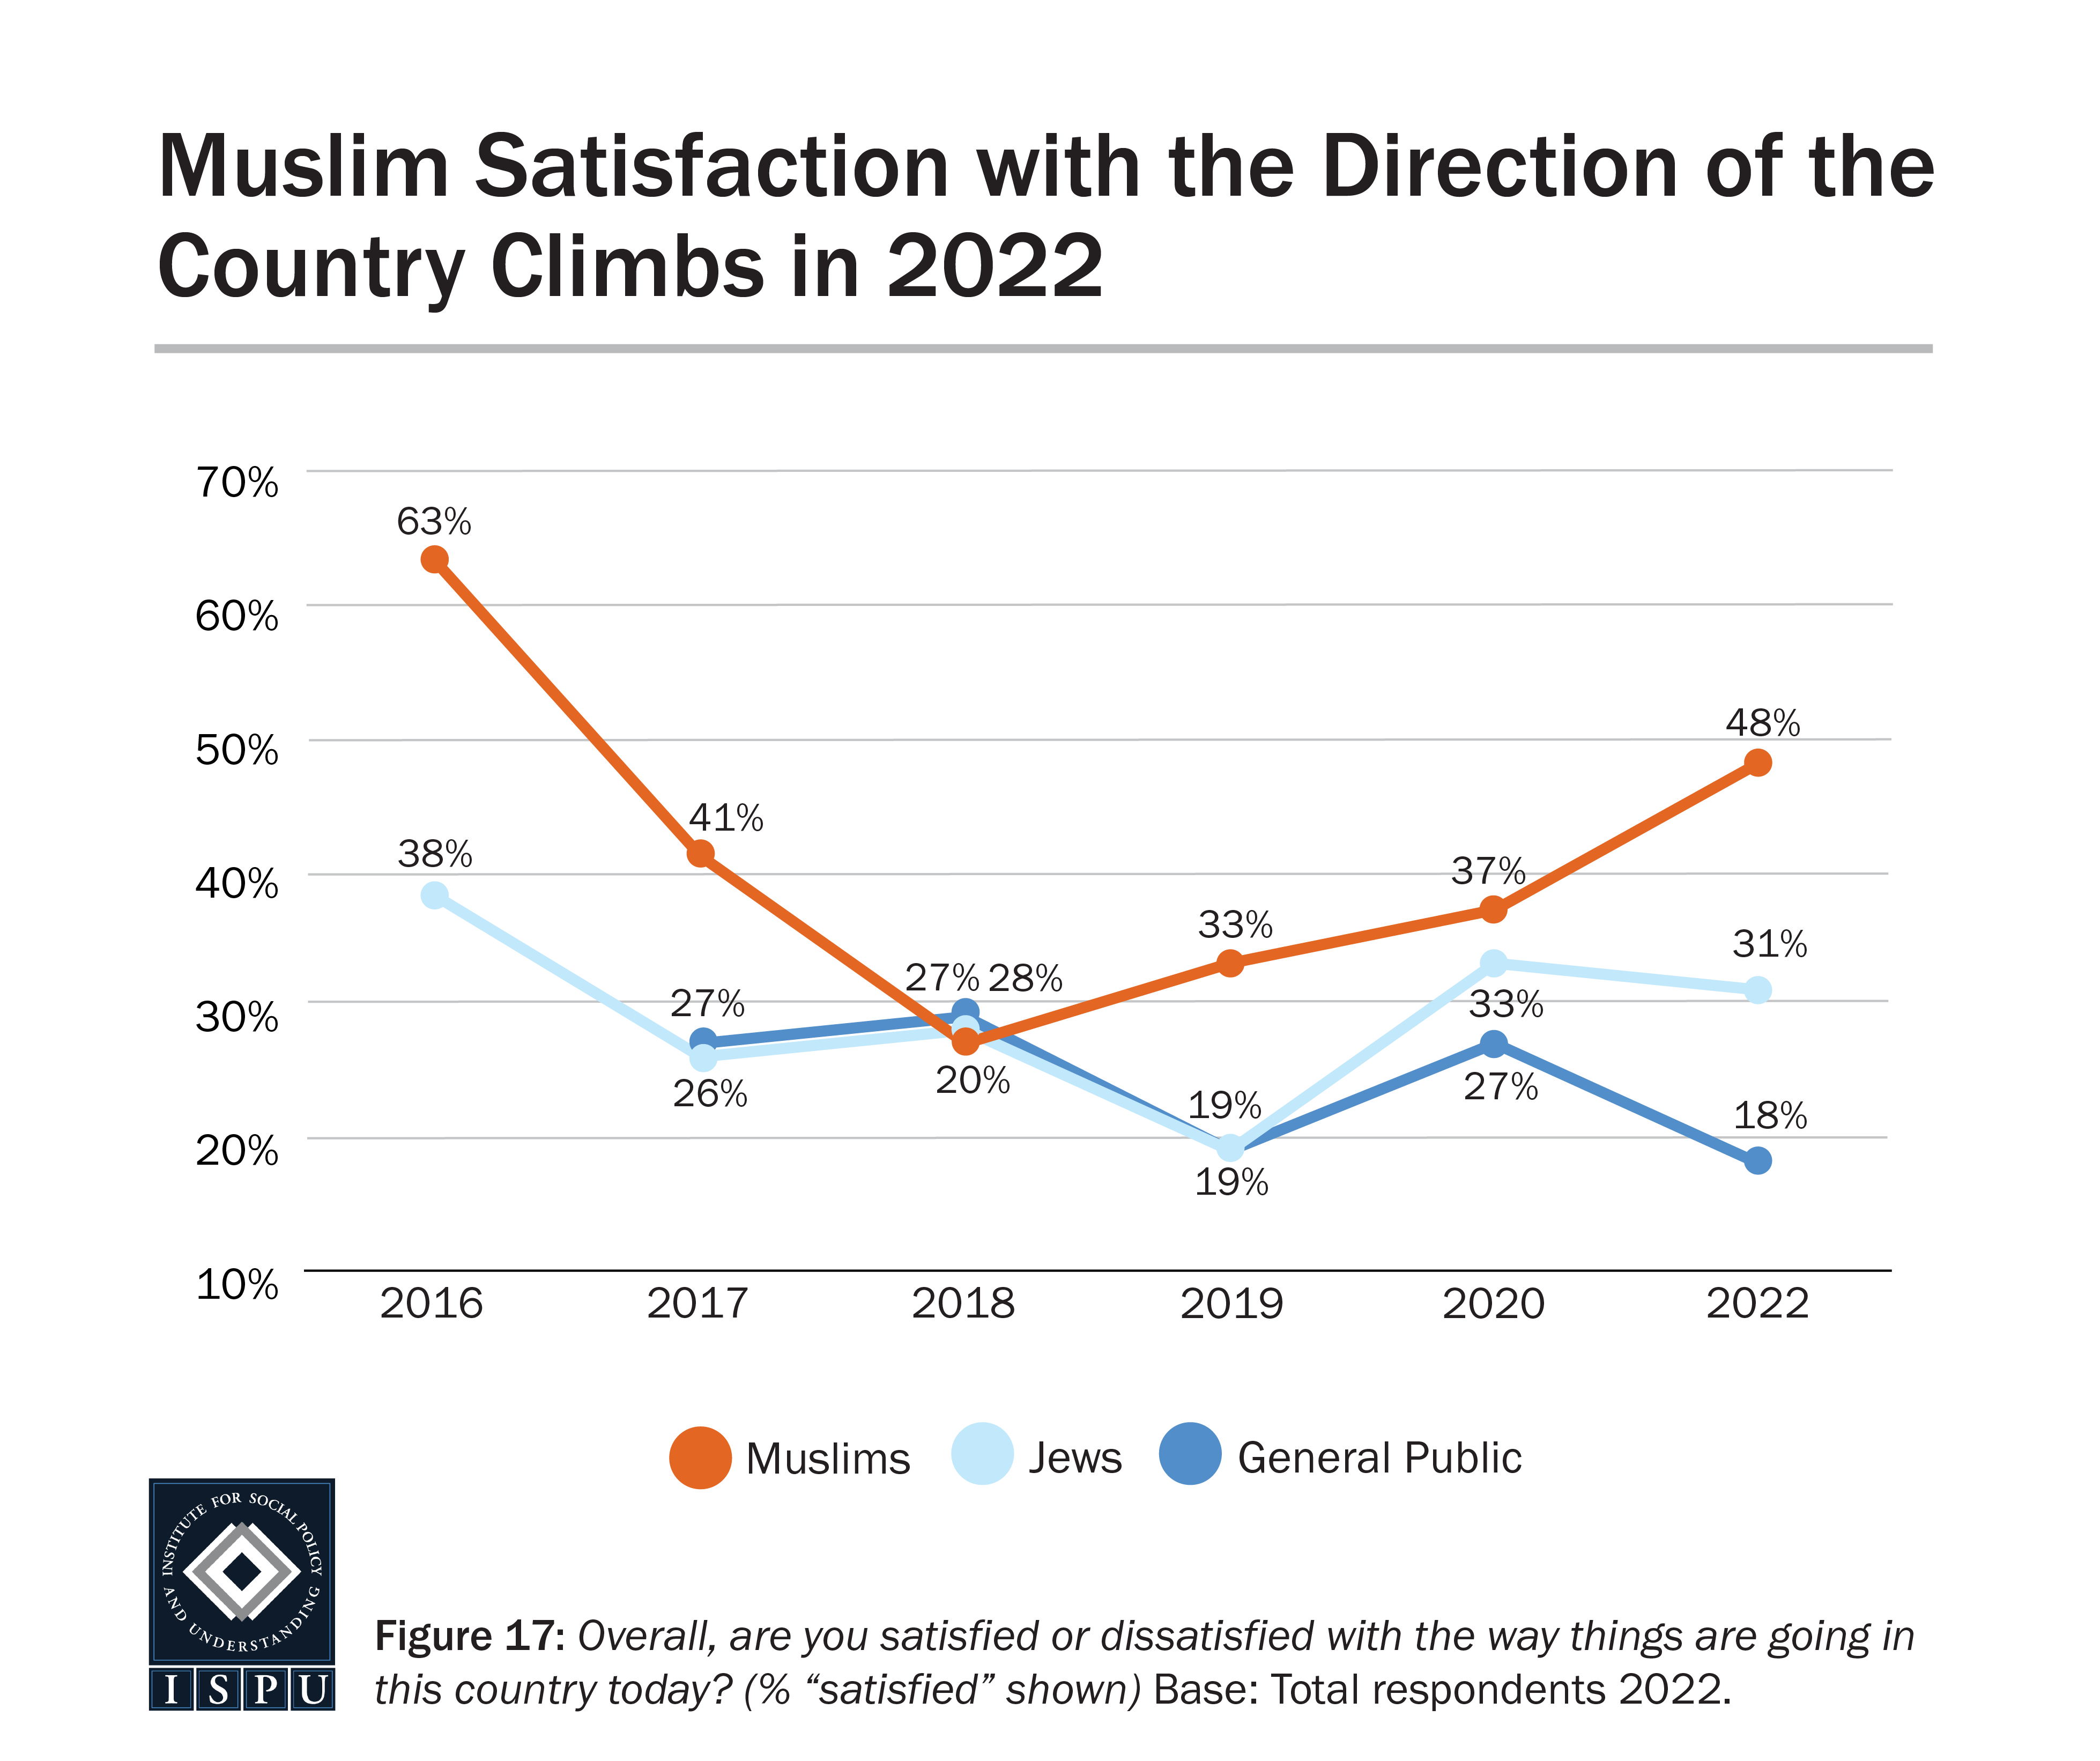
Muslim Satisfaction with the Direction of the Country Increased in 2022
Muslims are more likely to be satisfied with the direction of the country in 2022 (48%), under President Biden, than during the four years under the Trump administration (41% in 2017, 27% in 2018, 33% in 2019, and 37% in 2020), during which Muslims were often targeted with negative rhetoric and policies.
Approval of President Biden
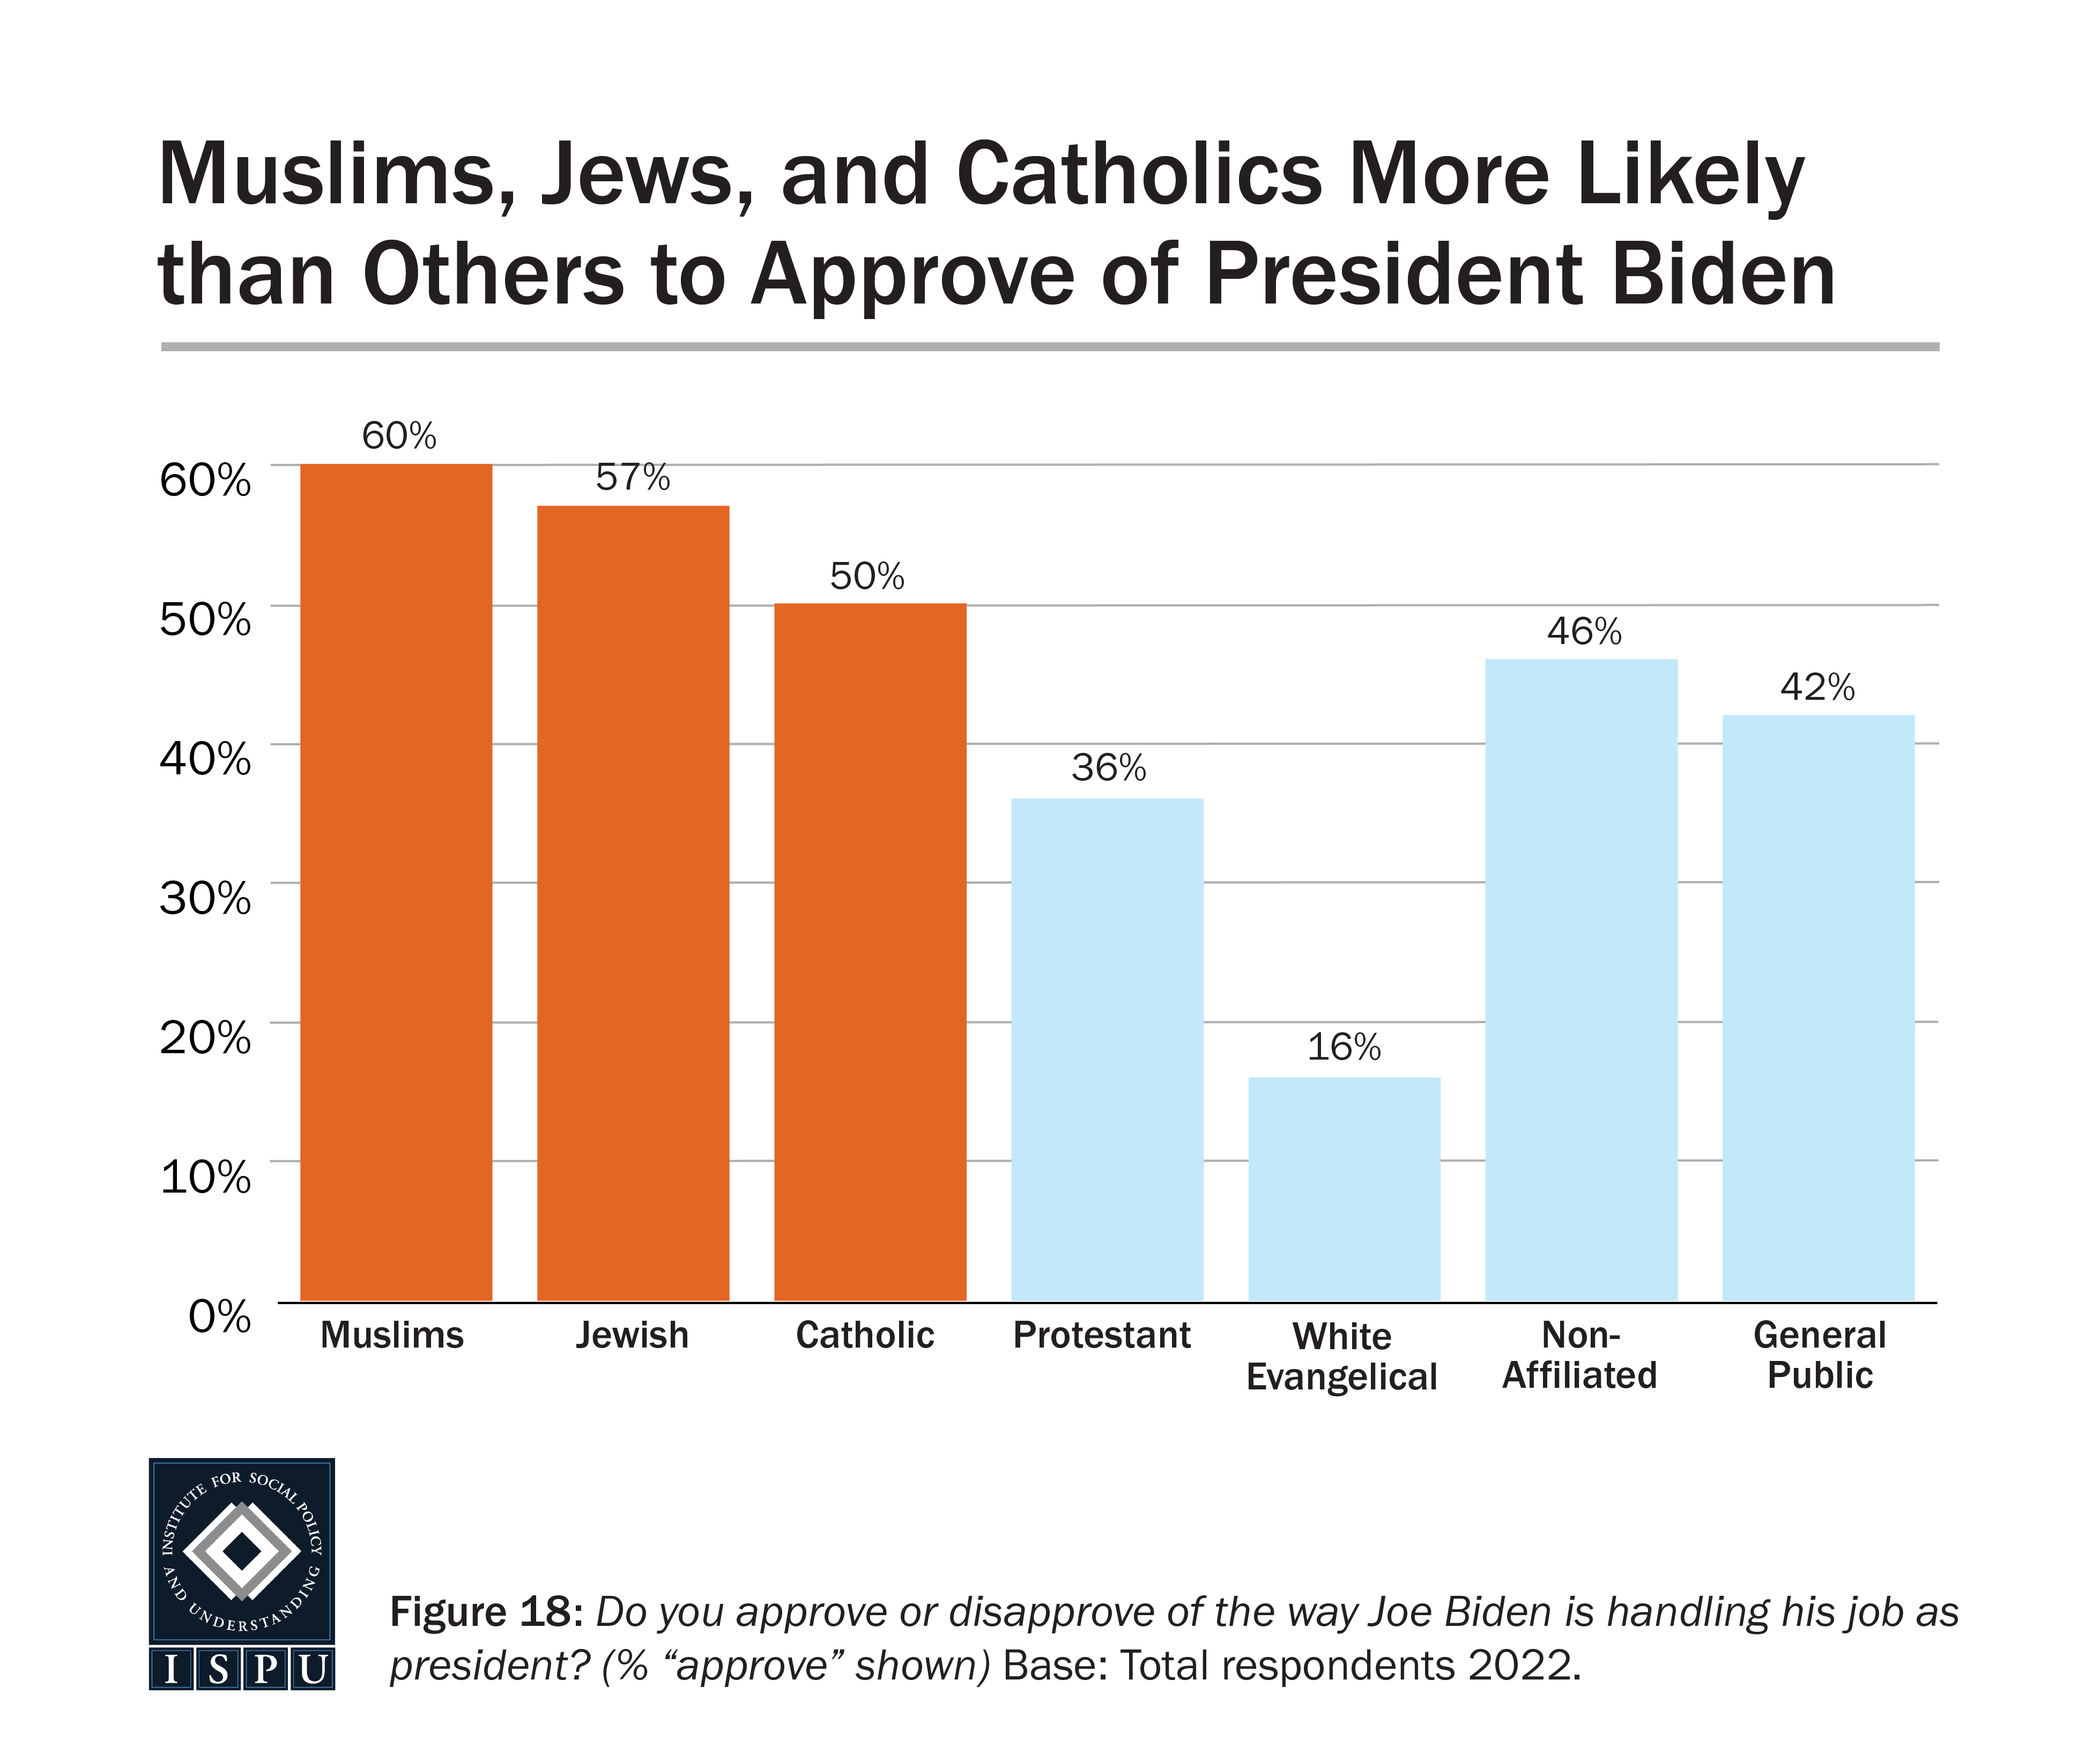
American Muslims More Likely than Other Groups to Approve of President Biden’s Job Performance
Six in ten American Muslims (60%) approve of President Biden’s job performance, more likely than Protestants (36%), white Evangelicals (16%), the nonaffiliated (46%), and the general public (42%). Jewish Americans and Catholics were on par with Muslims in their approval of President Biden (57% and 50%, respectively). Among all faith groups surveyed, there were no differences by gender in approval of President Biden’s job performance. However, among the general public, women were more likely than men to approve (47% vs. 36%, respectively).
Young Muslims and Arab Muslims Least Likely to Approve of Biden
When looking at presidential approval by age, we find that the youngest Muslims are the least likely to approve. Among Muslims, 18-29-year-olds were less likely than older Muslims to approve (48% vs. 64% of 30-49-year-olds and 73% of those 50+ years old). There were no differences by age on presidential approval among the general public.
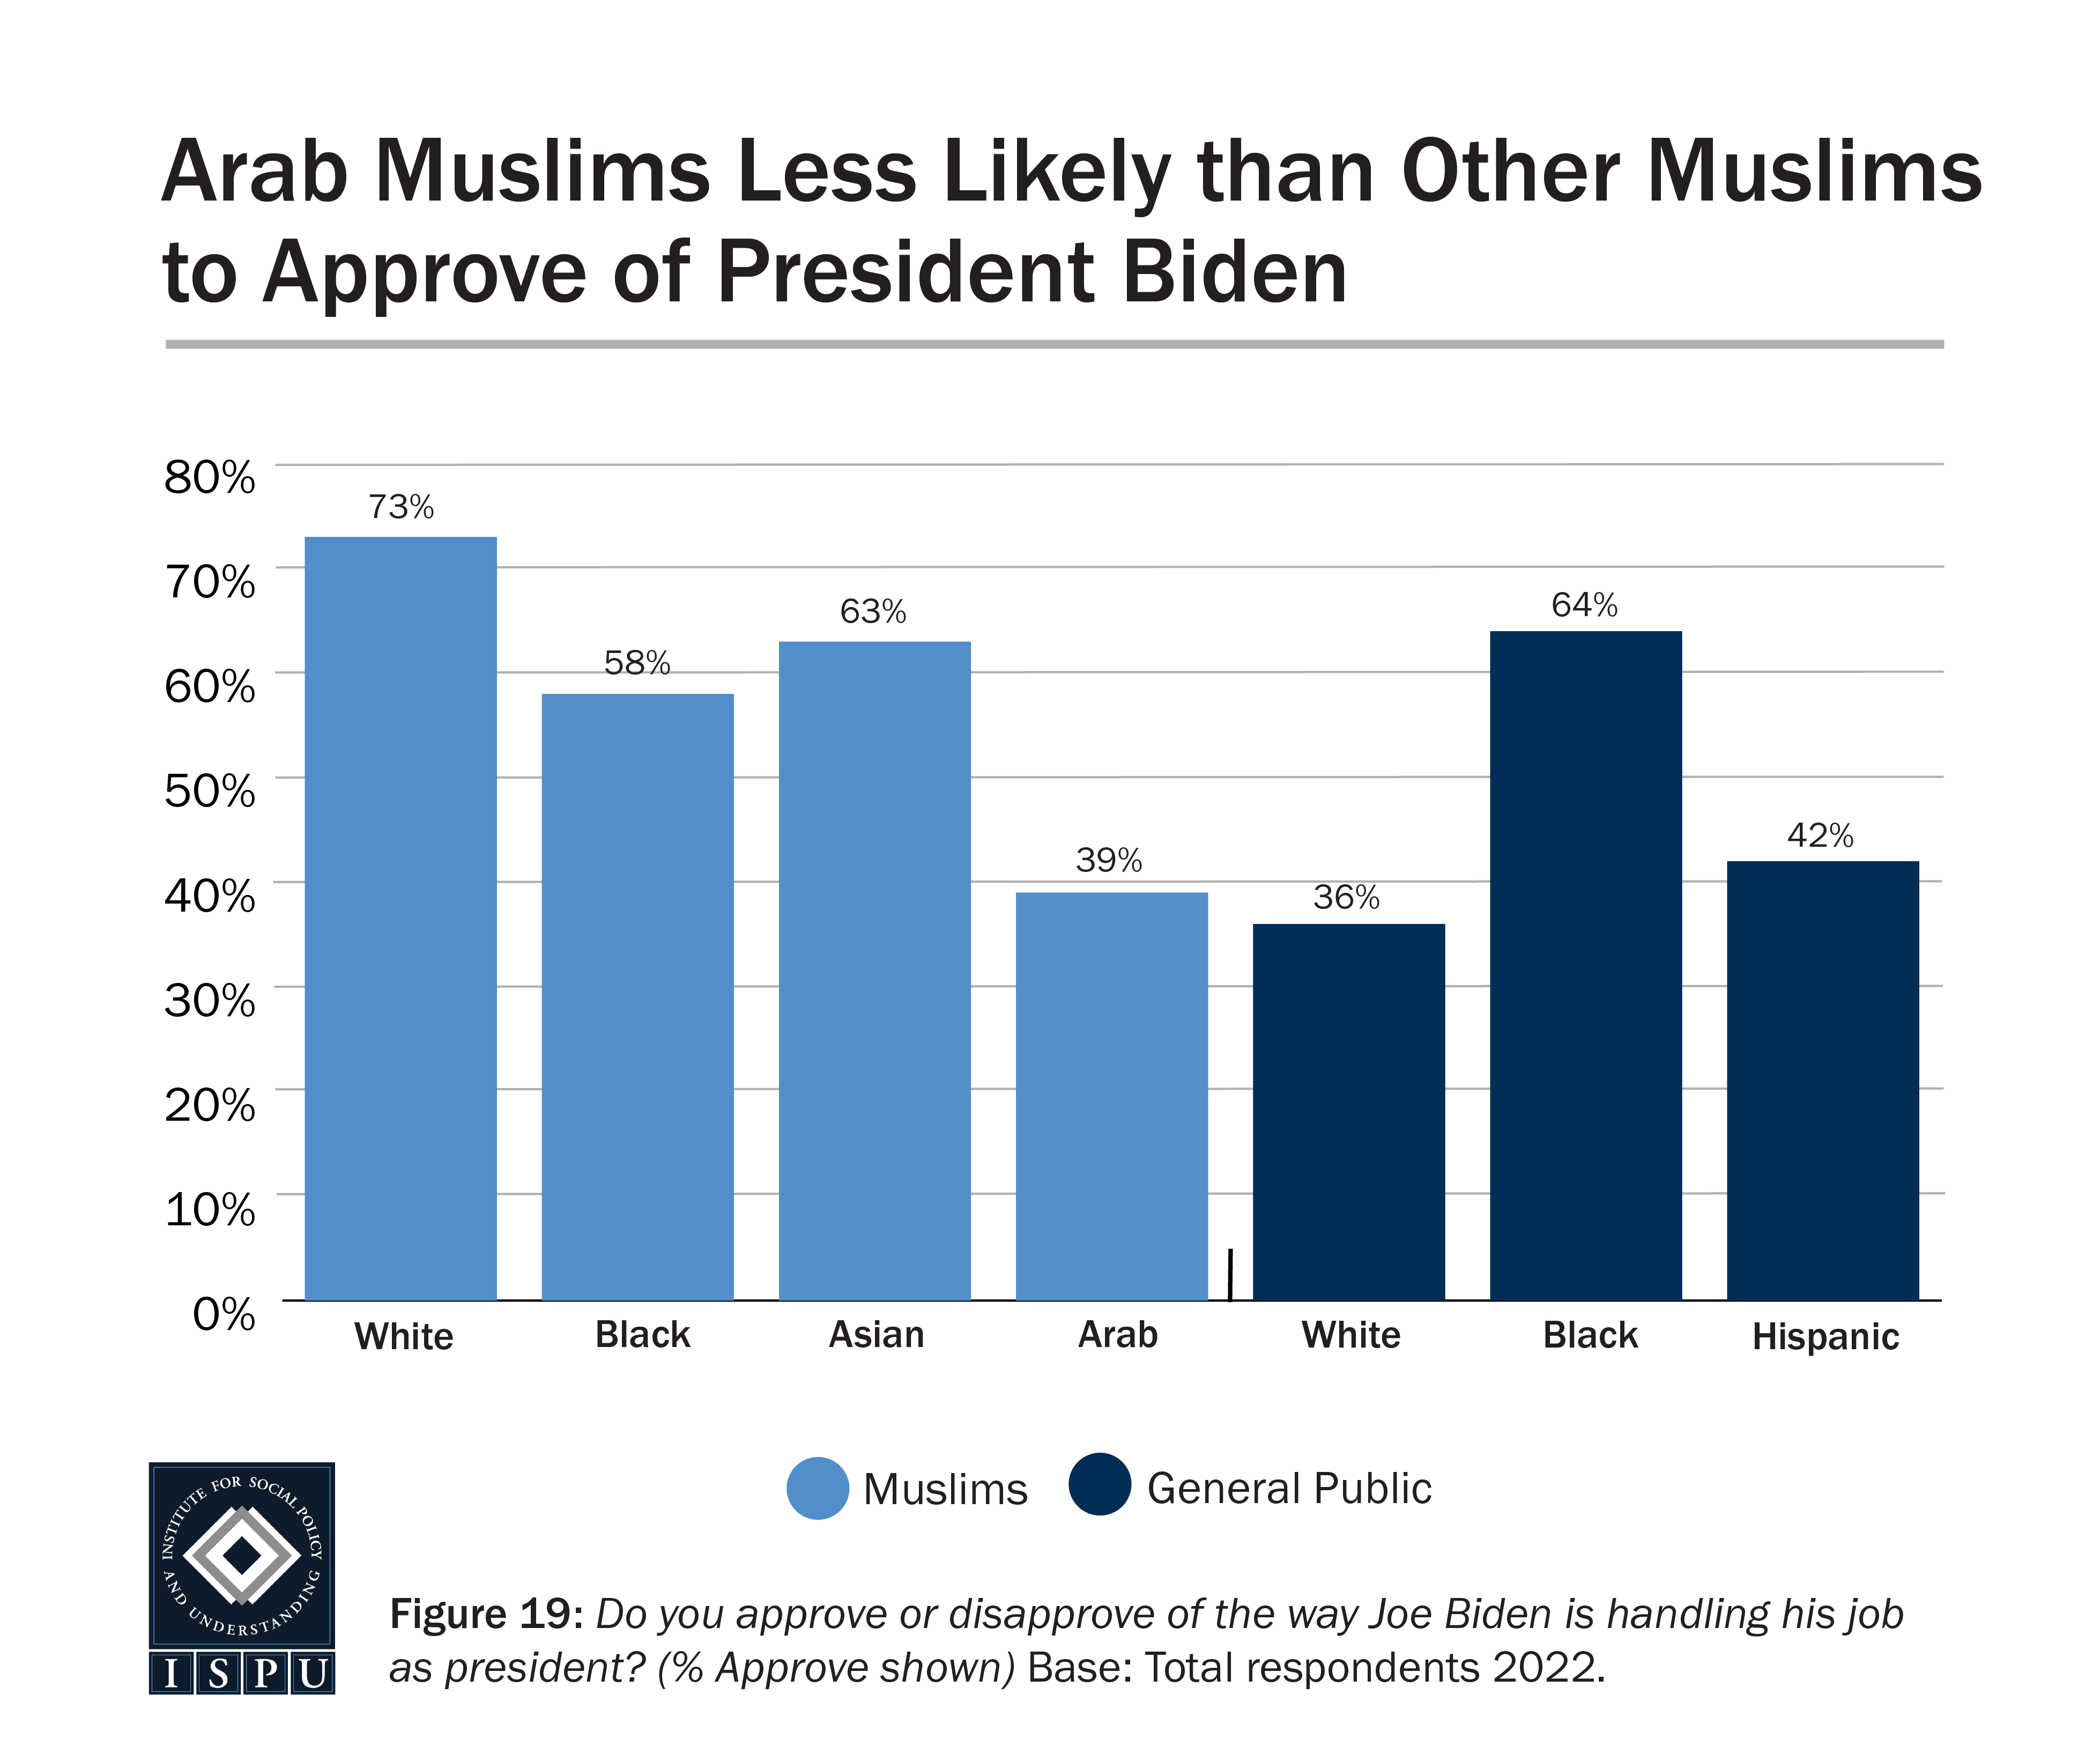
When looking by race and ethnicity, we find that Arab Muslims are least likely to approve of President Biden’s job performance. Arab Muslims (39%) are less likely than Black Muslims (58%), white Muslims (73%), and Asian Muslims (63%) to approve of President Biden’s job performance. Nearly three-quarters of white Muslims approve, higher than approval by Black and Arab Muslims. Among the general public, Black Americans (64%) are more likely than whites (36%) and Hispanics (42%) to approve. While Black Muslims are on par with Black Americans in the general public in terms of their presidential approval (58% and 64%, respectively), white Muslims are more likely than white Americans in the general public to approve (73% vs. 36%).
American Muslim Presidential Approval Climbs Post-Trump Administration
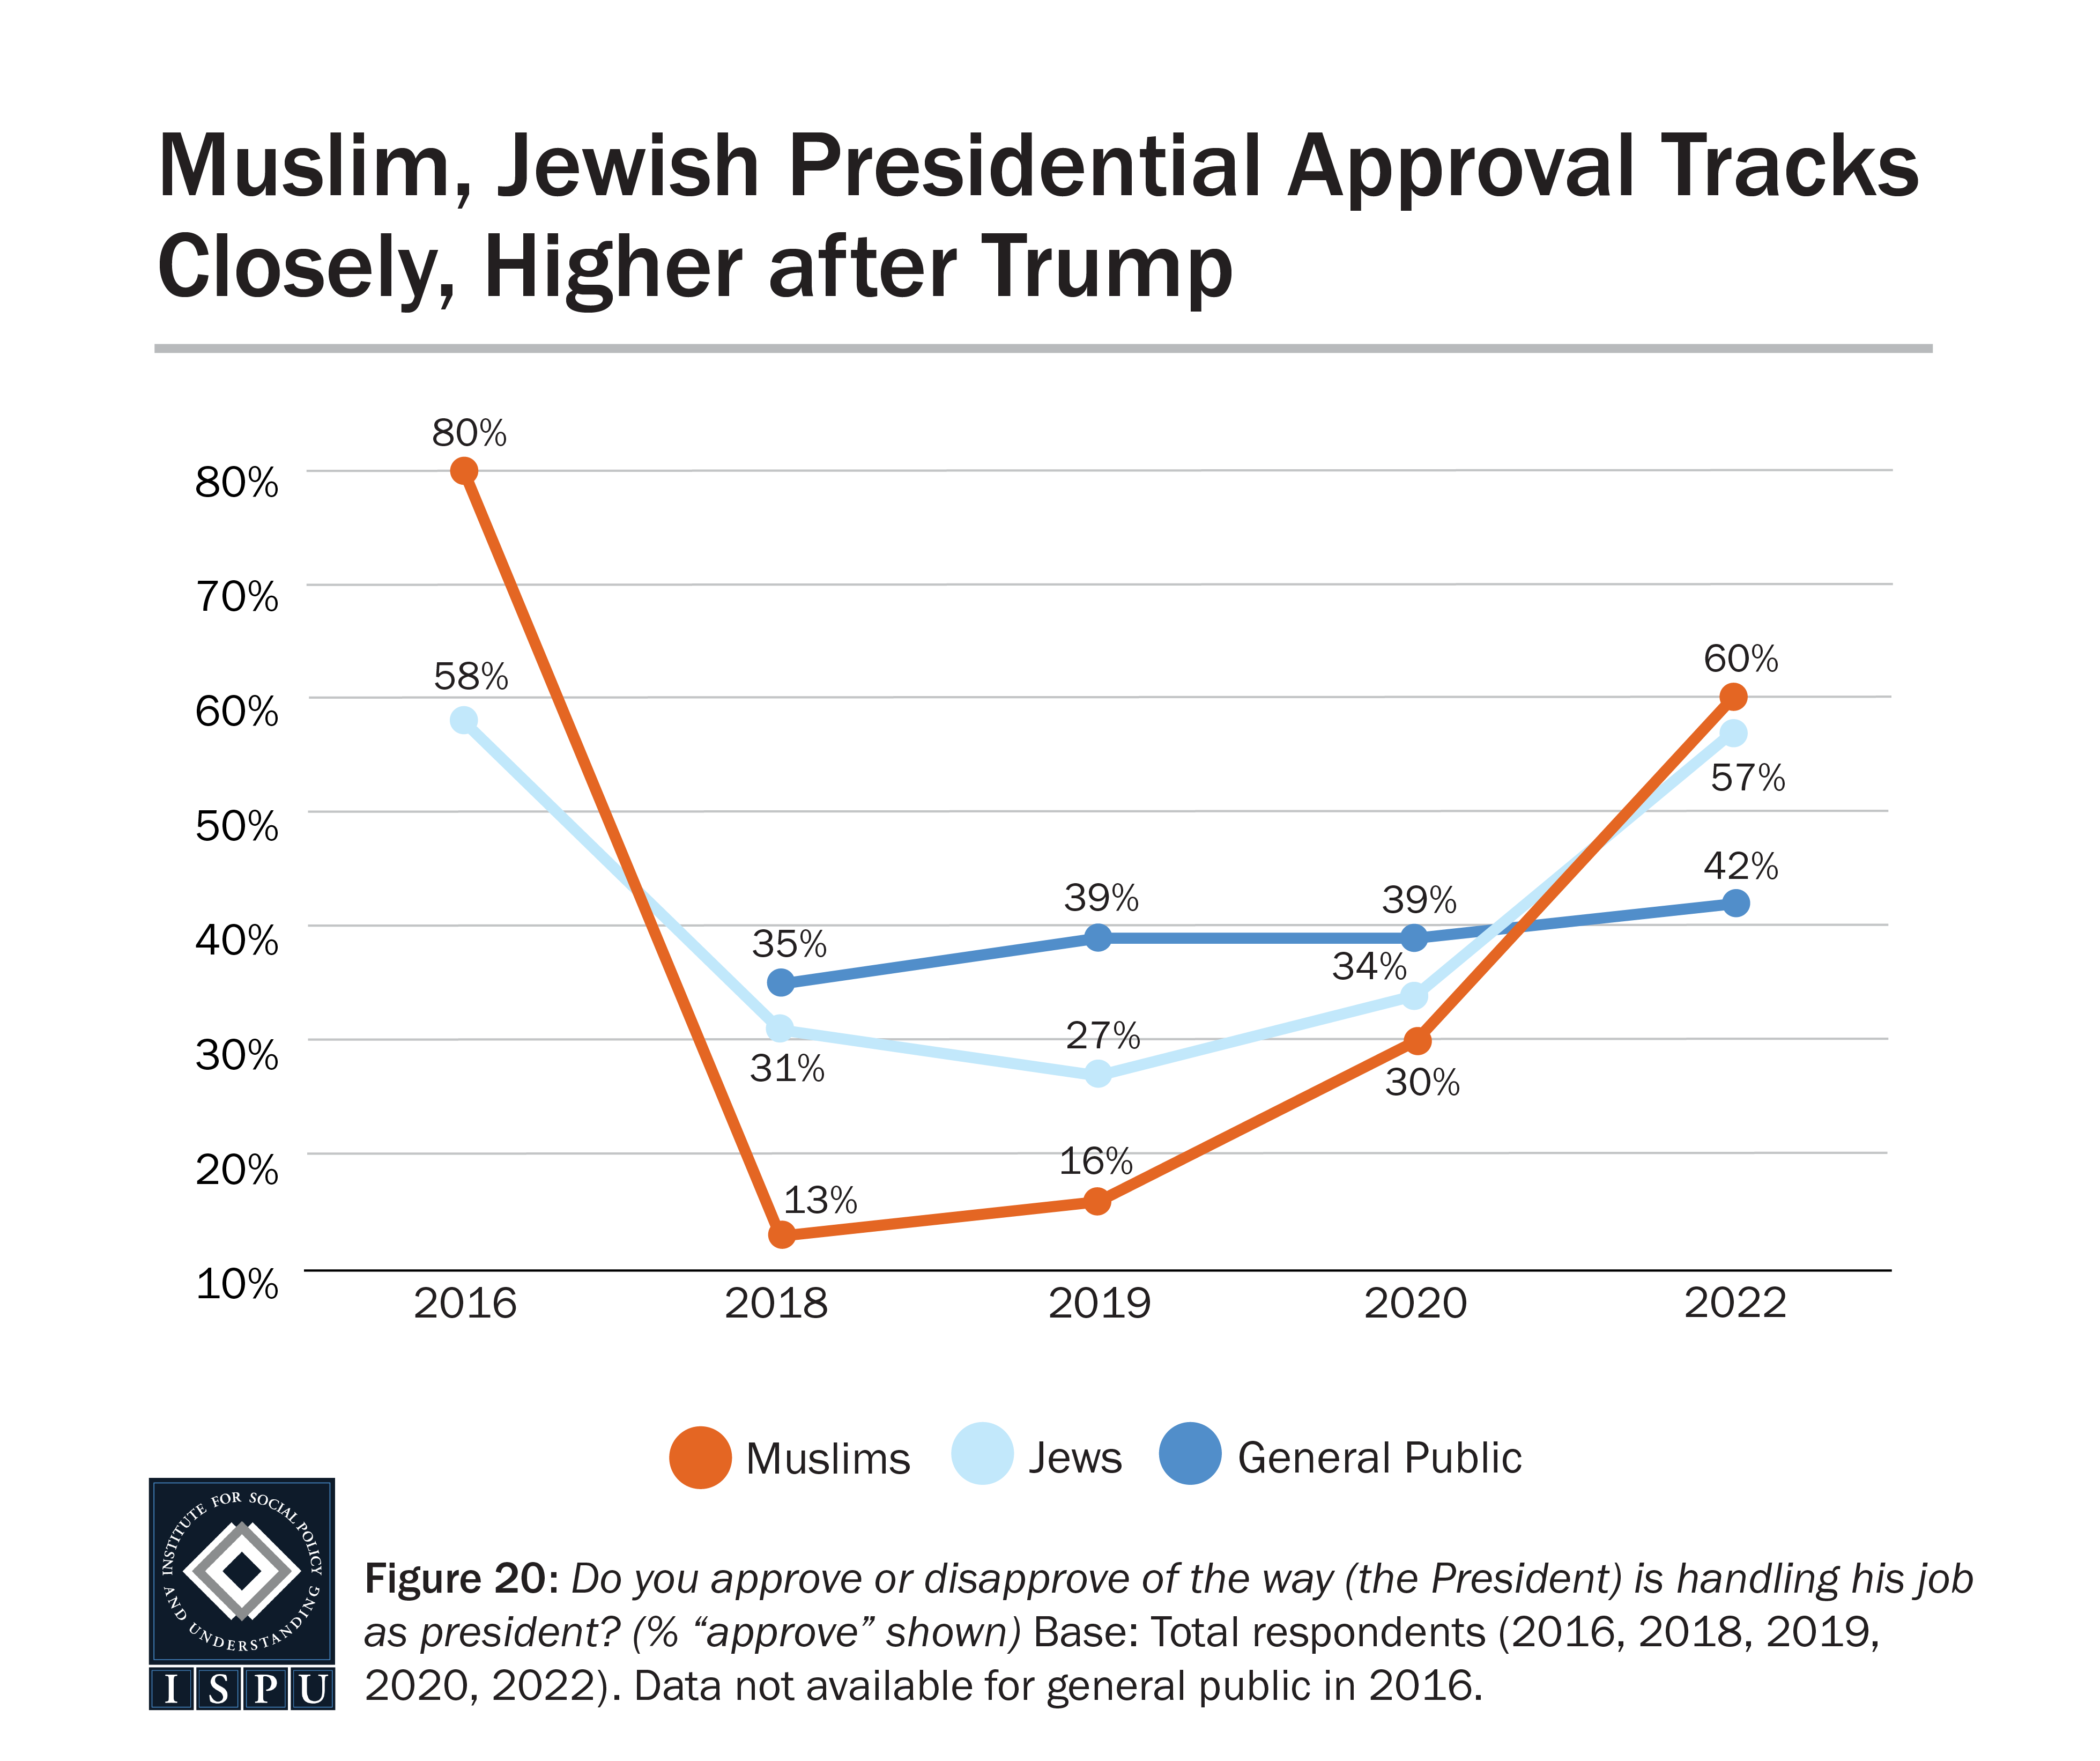
For both American Muslims and Jews, presidential approval in 2022 rebounded after four years of the Trump administration. In 2022, 60% of Muslims and 57% of Jews expressed approval, compared to a low of 13% in 2018 for Muslims and 27% in 2019 for Jews. In 2016, during the last year of the Obama presidency, 80% of Muslims and 58% of Jews expressed approval.
For both American Muslims and Jews, presidential approval in 2022 rebounded after four years of the Trump administration.
Voter Registration
Voter Registration Continues to Climb Steadily
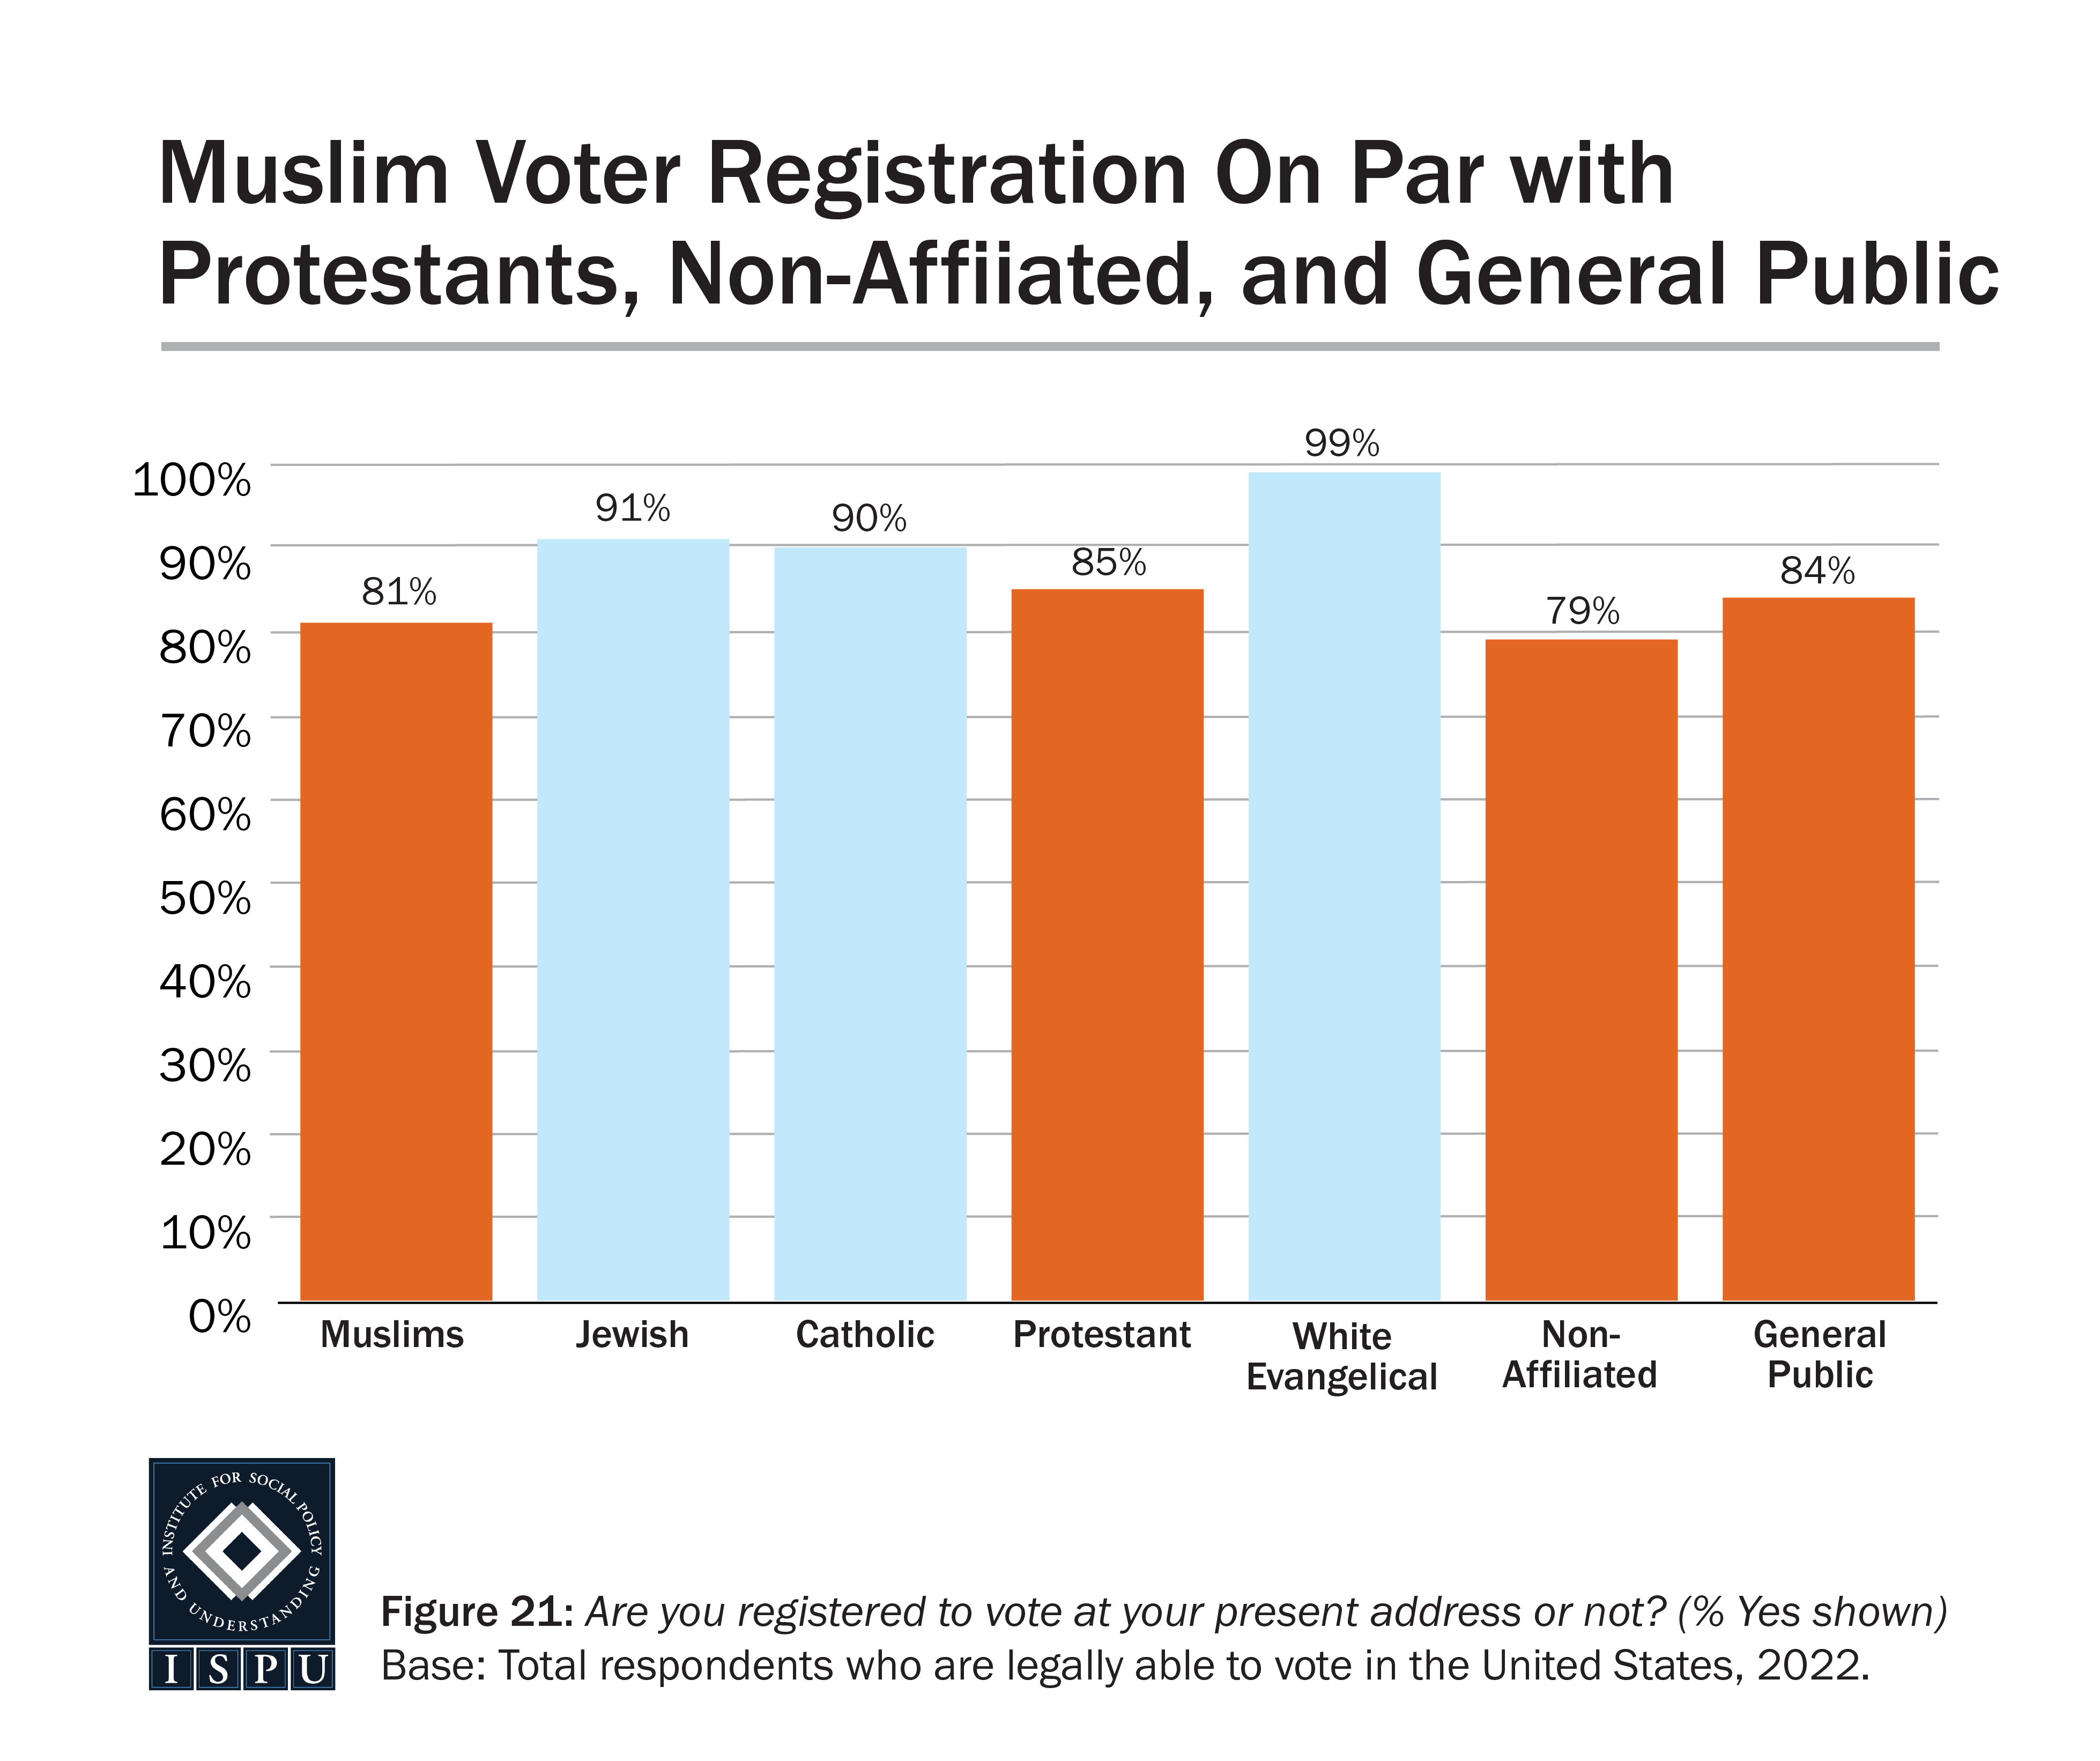
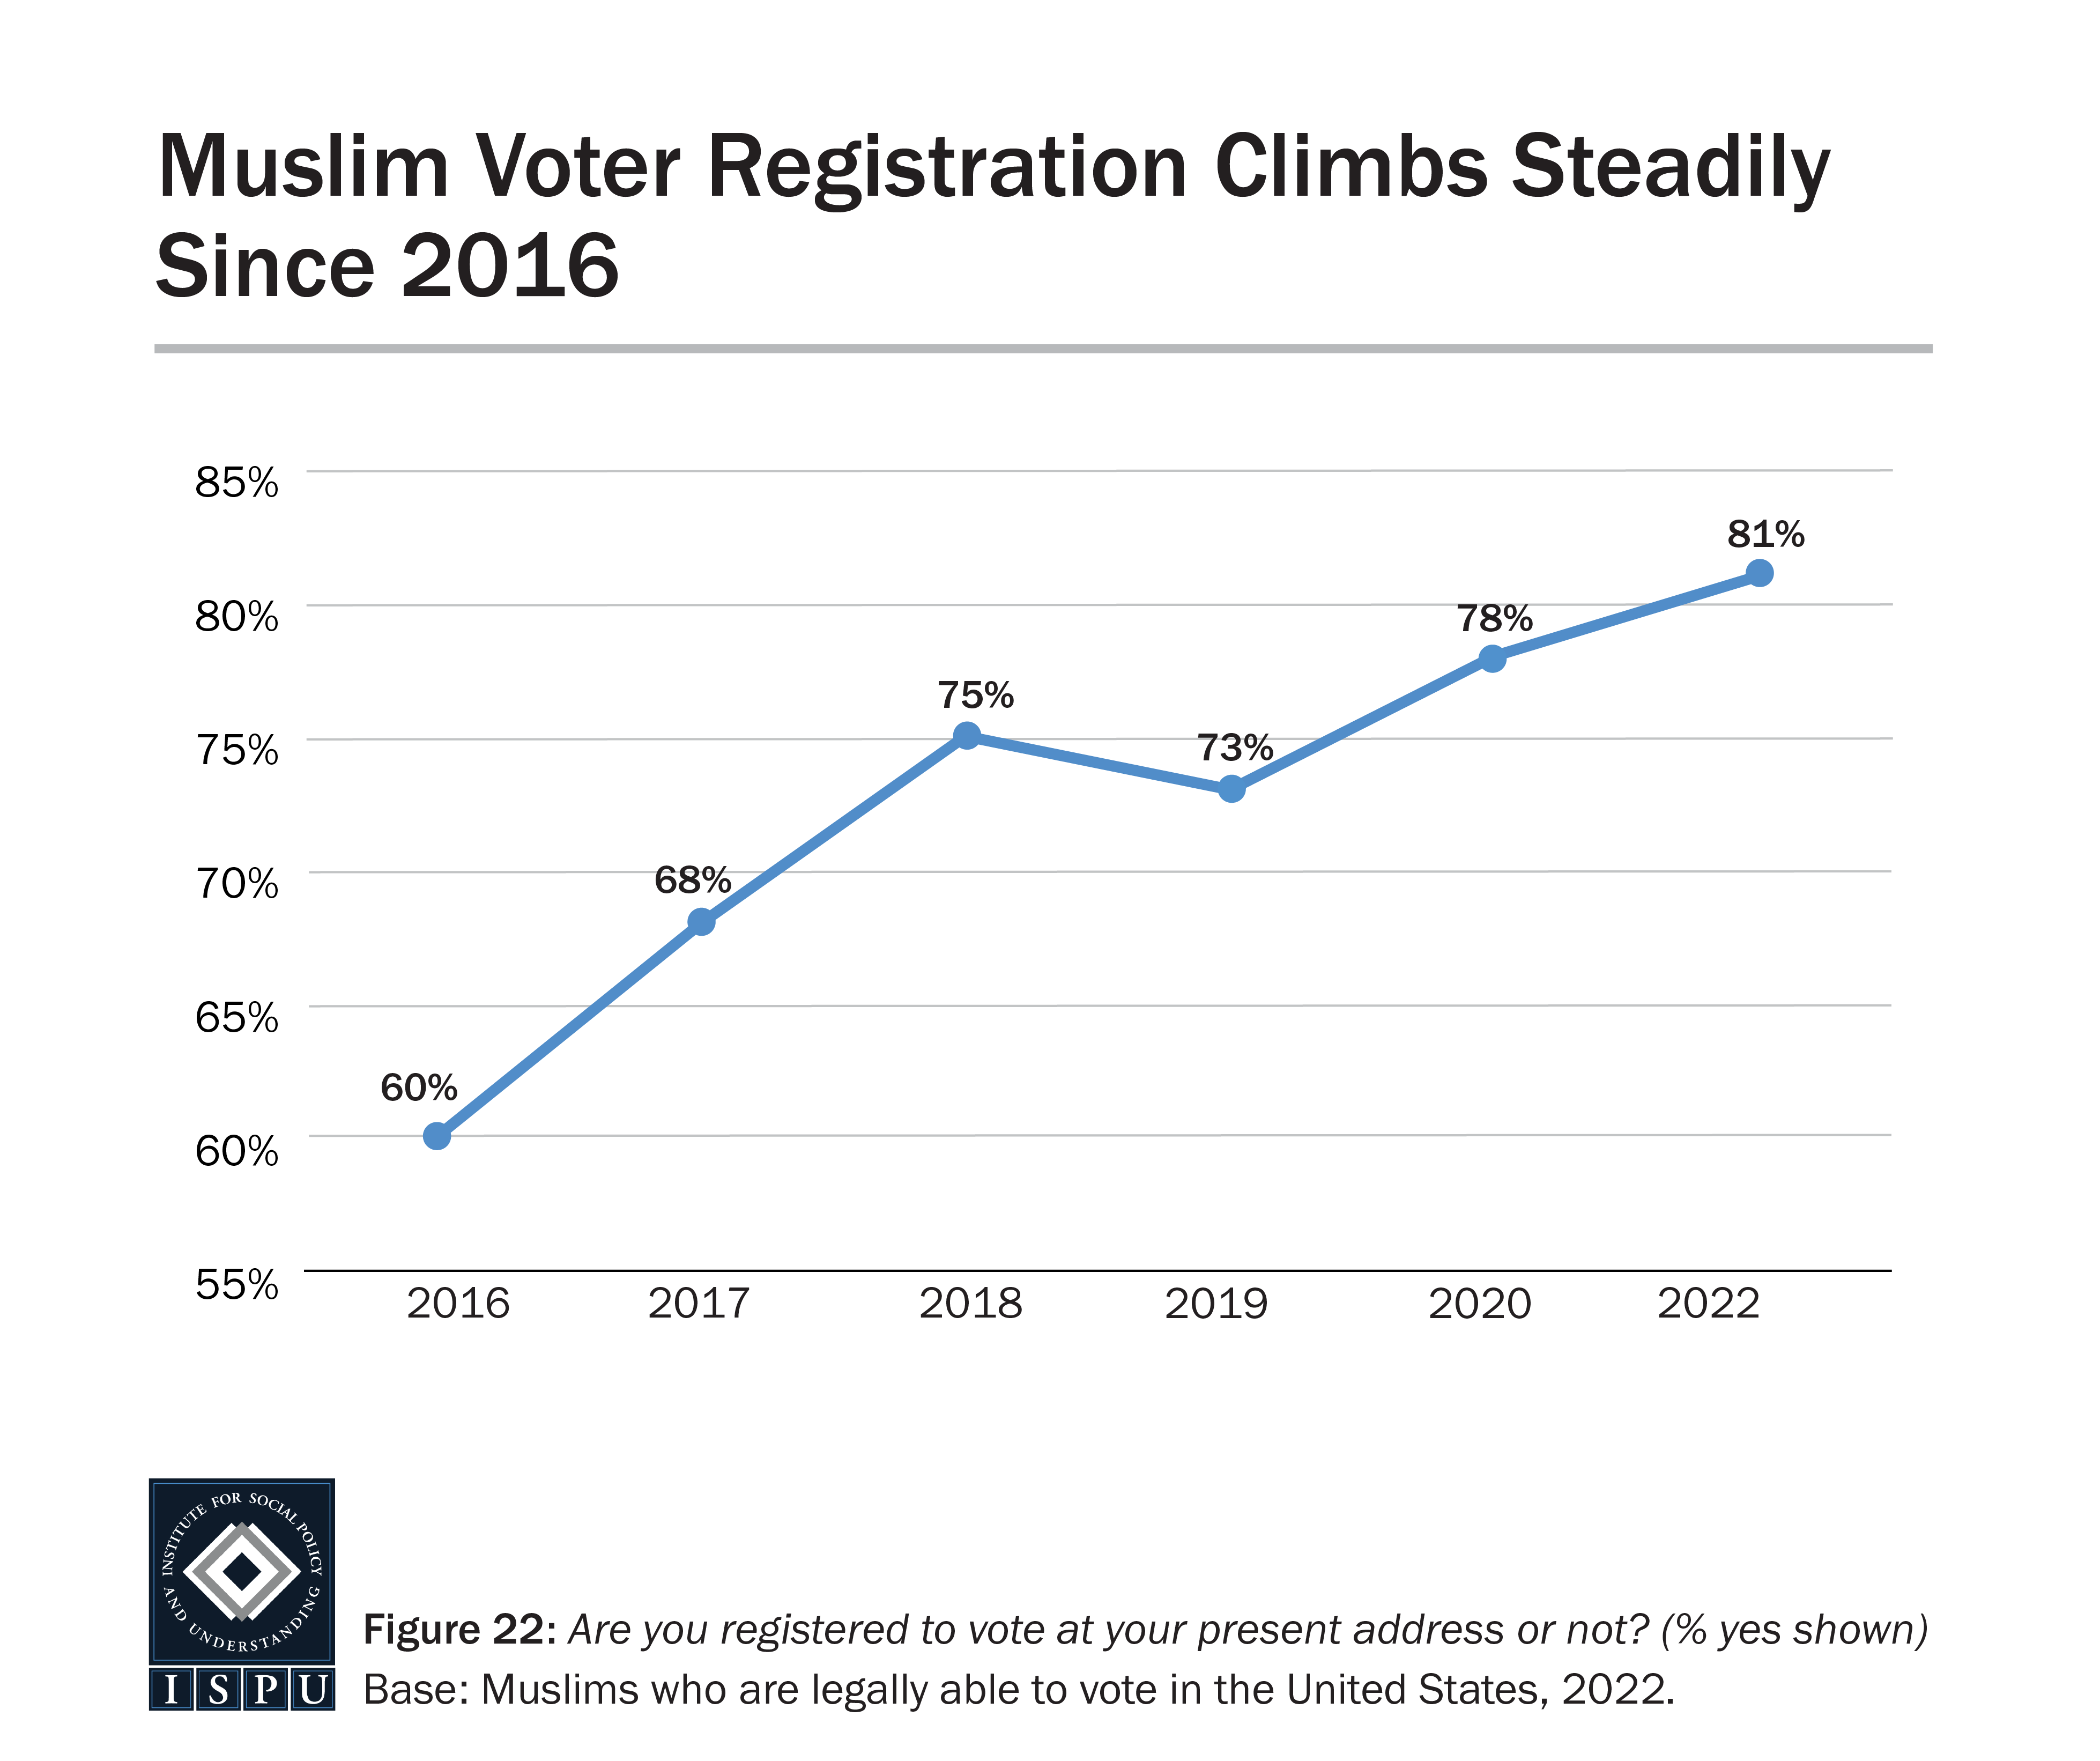
In 2022, nearly eight in 10 American Muslims (79%) are eligible to vote in the US, which is significantly lower than the more than 90% of all other groups surveyed. Among those who are eligible to vote, 81% of American Muslims are registered to vote, on par with 85% of eligible Protestants, 79% of the nonaffiliated, and 84% of the general public. Eligible Jewish Americans (91%), Catholics (90%), and white Evangelicals (99%) were most likely to be registered to vote.
Among Muslims and Catholics who are eligible to vote, men are more likely than women to be registered to vote (88% of Muslim men vs. 72% of Muslim women and 99% of Catholic men vs. 82% of Catholic women), presenting an opportunity for GOTV efforts to target women with outreach and messaging.
Among Muslims, there were no age or racial/ethnic differences in voter registration. When comparing between Muslims and the general public, we find that white Muslims are less likely than white Americans in the general public to be registered to vote (82% vs. 88%, respectively). Black Muslims and Black Americans in the general public are on par in terms of voter registration (78% and 82%, respectively), as are age cohorts of Muslims with their counterparts in the general public.
Among the general public, however, we find differences by age and race/ethnicity. Specifically, 18-29-year-olds in the general public are less likely than older Americans to be registered (73% of 18-29-year-olds vs. 85% of 30-49-year-olds and 88% of those 50+ years old). Additionally, white Americans are more likely than Hispanics to be registered (88% vs. 74%, respectively).
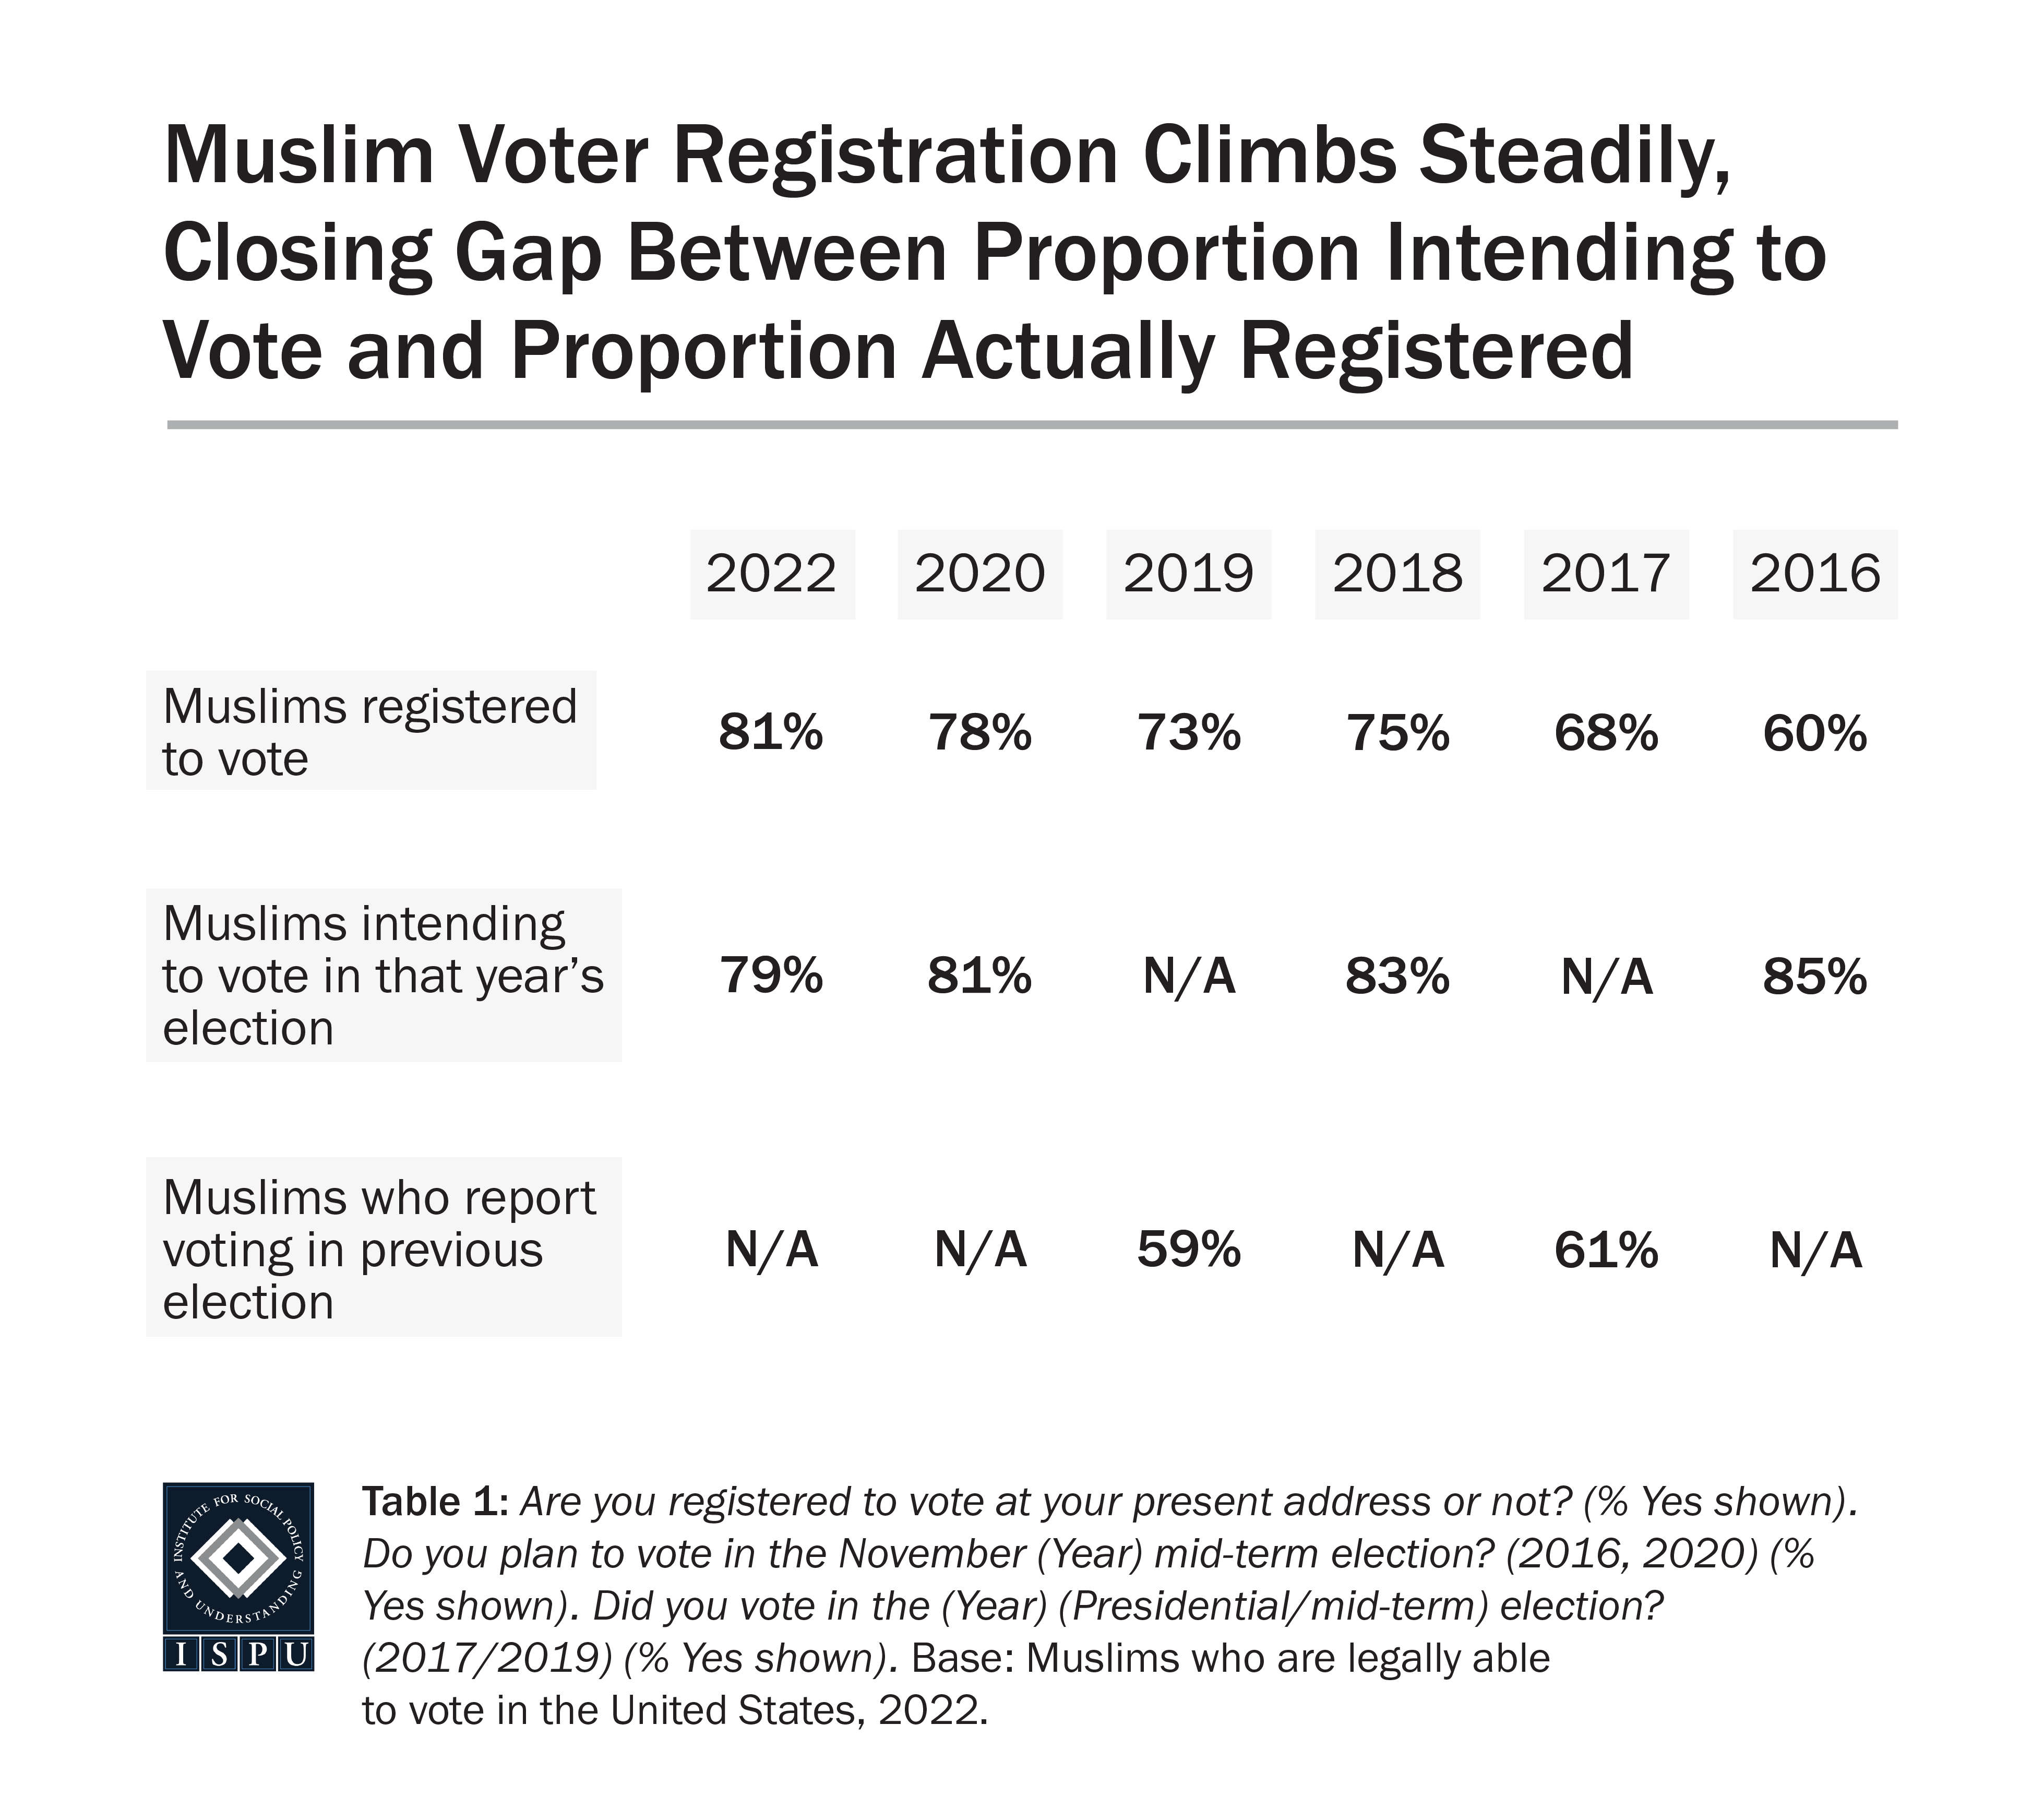
Looking over time, American Muslim voter registration has increased significantly from 60% in 2016 to 81% in 2022. This reflects the efforts of various GOTV campaigns, voter registration drives, and the work of American Muslim civic organizations. Additional gains in voter registration in the years ahead will require identifying and reaching out to particular segments of the American Muslim community. These data suggest Muslim women as a group for additional voter registration outreach, as mentioned earlier.
Gap Closes Between Intention to Vote and Voter Registration
In 2016, ISPU identified a segment of the Muslim community we coined the “Insha’Allah voter,” those who say they intend to vote in upcoming elections but have not registered to do so. In 2022, for the first time in six years of the American Muslim Poll, we find no difference between the percent intending to vote (79%) and the percent registered to vote (81%)—meaning there are no ‘Insha’Allah voters’ for the 2022 midterm elections. This suggests Muslims are either already registered to vote or do not plan to be.
Among eligible voters, Muslim men (86%) are more likely than Muslim women (70%) to express intention to vote in midterms. We find the same gender difference among eligible Catholics with 100% of Catholic men expressing an intention to vote in the 2022 midterms, compared with 86% of Catholic women. Similar to voter registration, we find no difference in intention to vote among age or racial/ethnic groups among Muslims. Among the eligible voters in the general public, however, younger people are less likely than older age groups to express an intention to vote in the 2022 midterm elections (69% of 18-29-year-olds vs. 81% of 30-49-year-olds and 87% of 50+-year-olds).
Despite continual gains in voter registration and closing the gap between intentions and voter registration, now is not the time to reduce or back away from GOTV efforts. Looking at years 2017 and 2019, when we asked whether survey respondents voted in the previous year’s election, we found that actual voting was consistently roughly 20% less than intention to vote. For example, in 2016, 85% of Muslims expressed an intention to vote in the 2016 presidential elections; however, in 2017, just 61% of Muslims responded that they had voted in the 2016 election. This suggests a greater need for GOTV campaigns even after folks are registered.
Obstacles to Voting
Muslims Most Likely Group to Experience Obstacles to Voting
New in 2022, we asked those who are eligible to vote about obstacles to voting faced in the past four years. Despite historic voter turnout in the 2020 presidential election, voter suppression remained an issue. While some have argued that voter suppression is an issue of the past, studies reveal that it persists and reflects racial discrimination in the voting process.
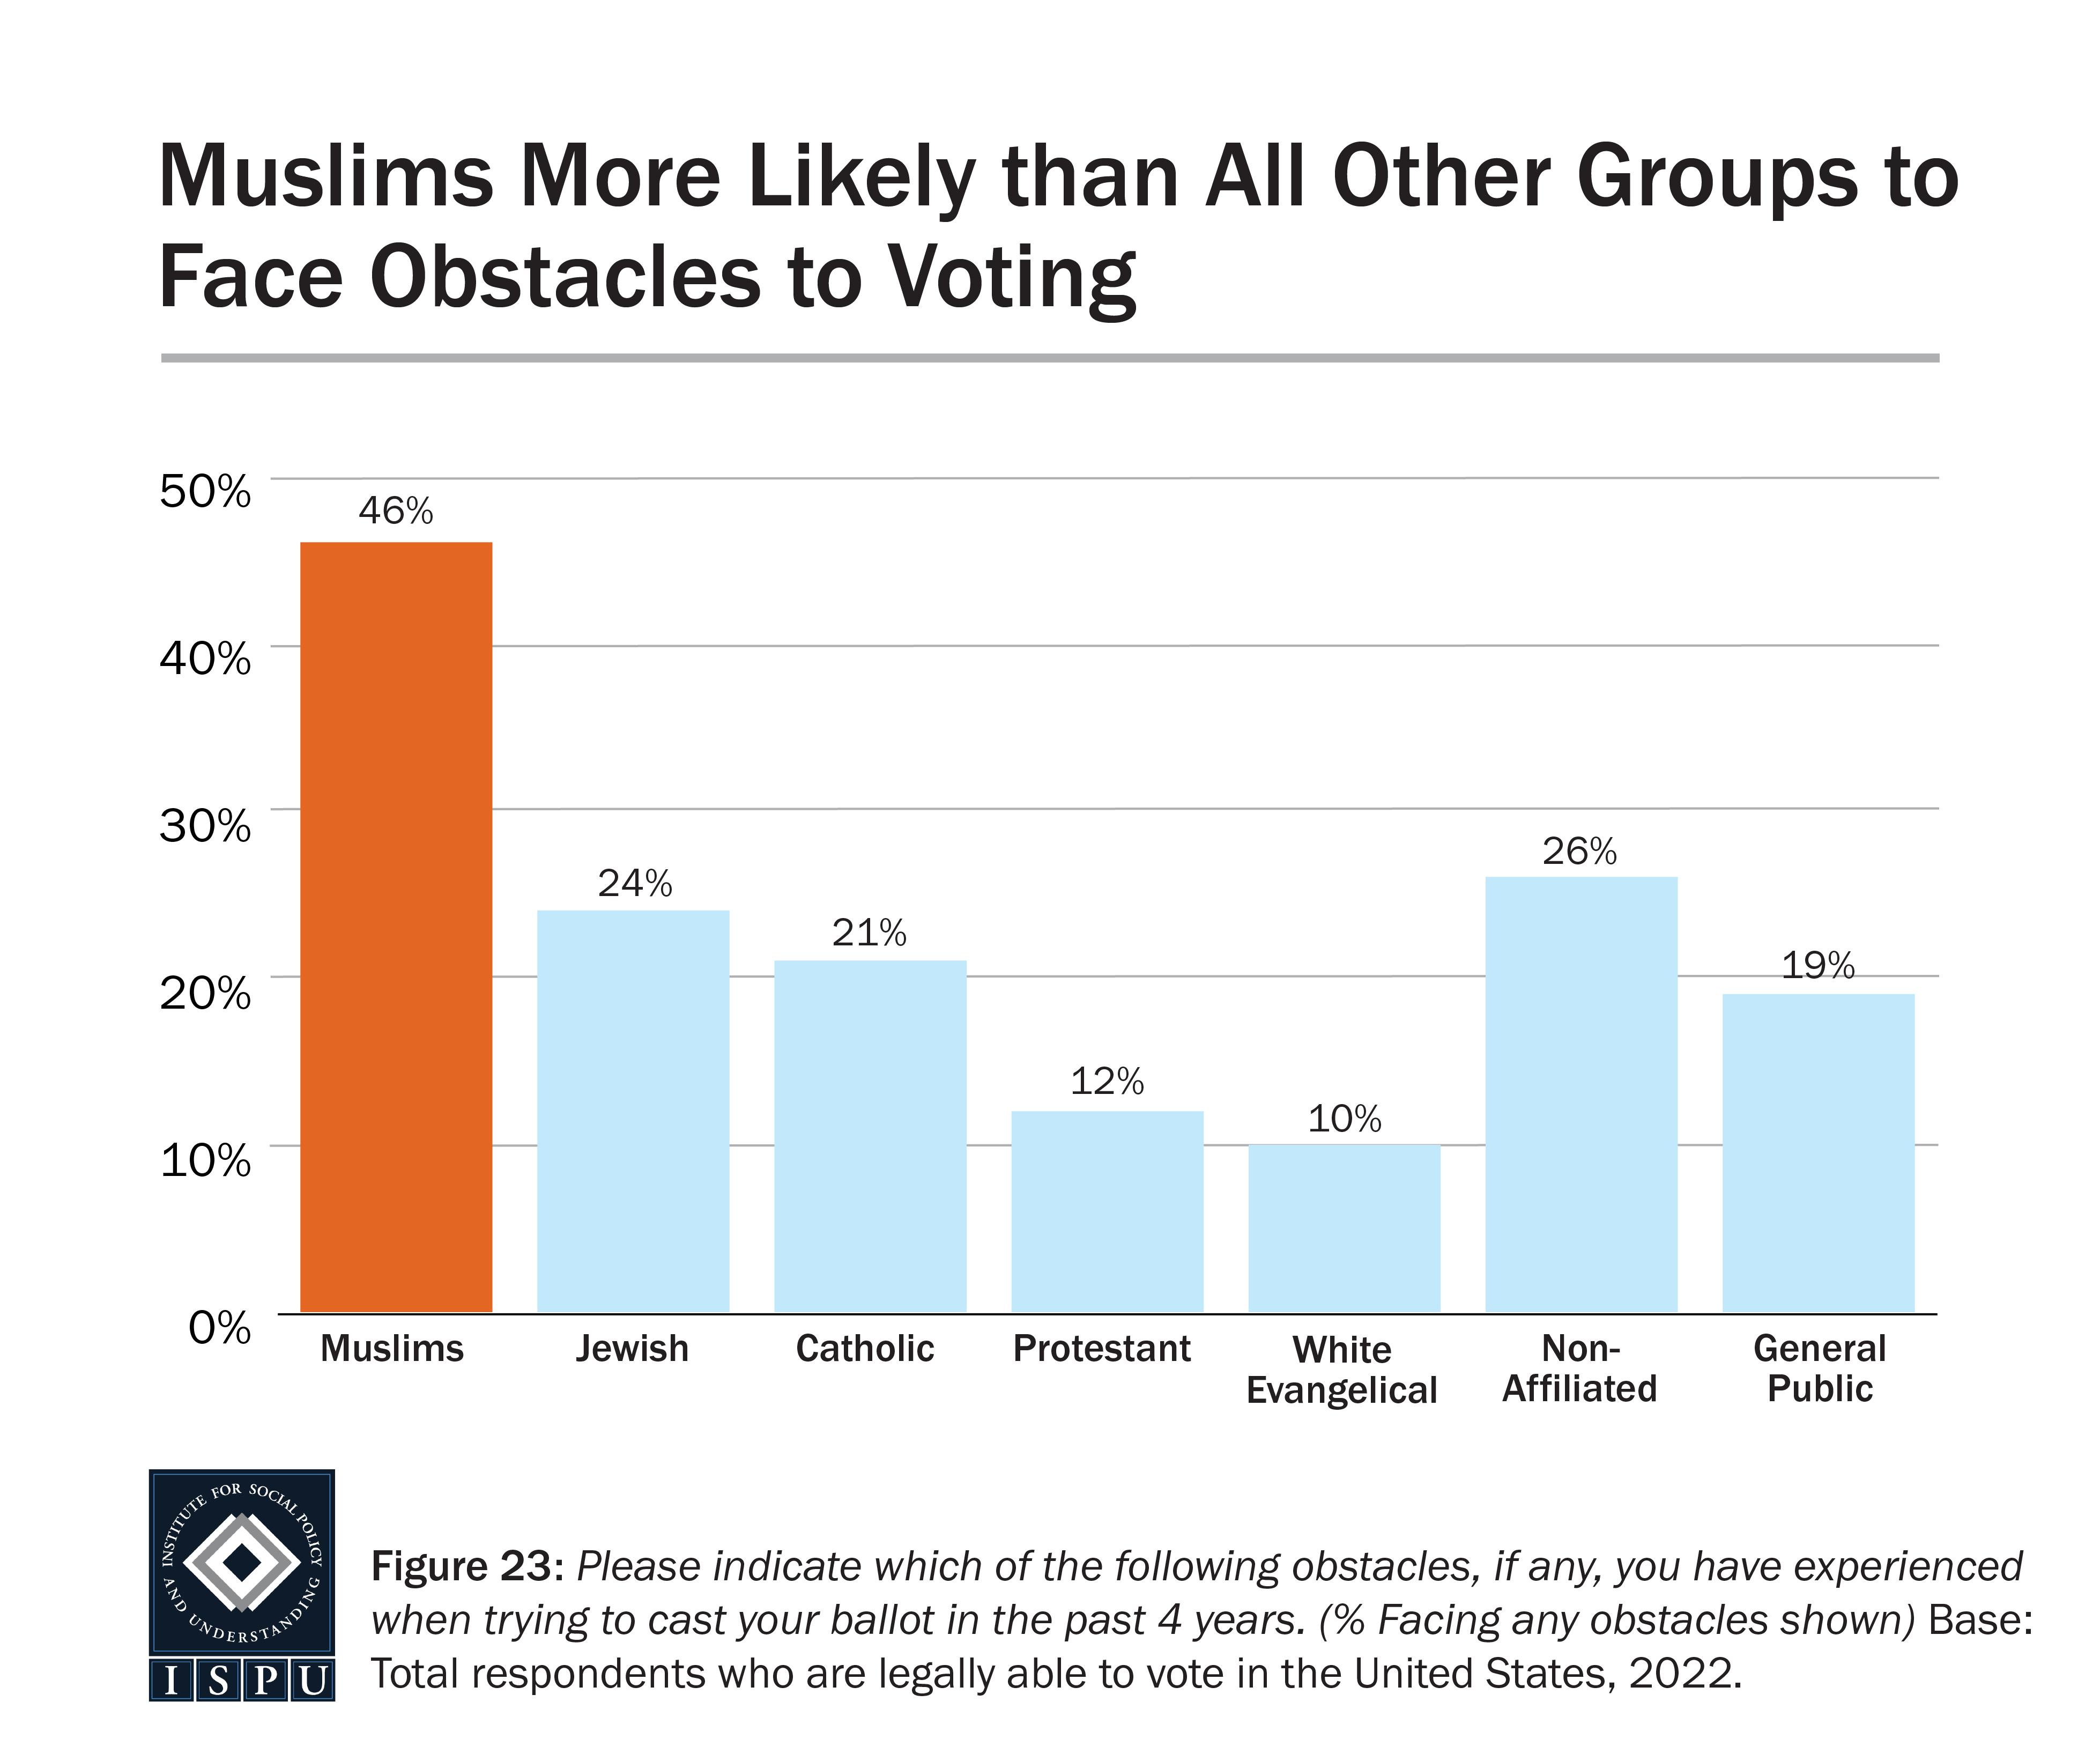
We find that nearly half (46%) of Muslims who are eligible to vote have experienced some obstacle to casting their vote, more so than any other group surveyed (24% of Jews, 21% of Catholics, 12% of Protestants, 10% of white Evangelicals, 26% of the nonaffiliated, and 19% of the general public). Among eligible voters, Muslim men were more likely than Muslim women to report facing obstacles to voting (52% vs. 38%, respectively).
We find that nearly half (46%) of Muslims who are eligible to vote have experienced some obstacle to casting their vote, more so than any other group surveyed
Younger Muslims Face Most Obstacles to Voting
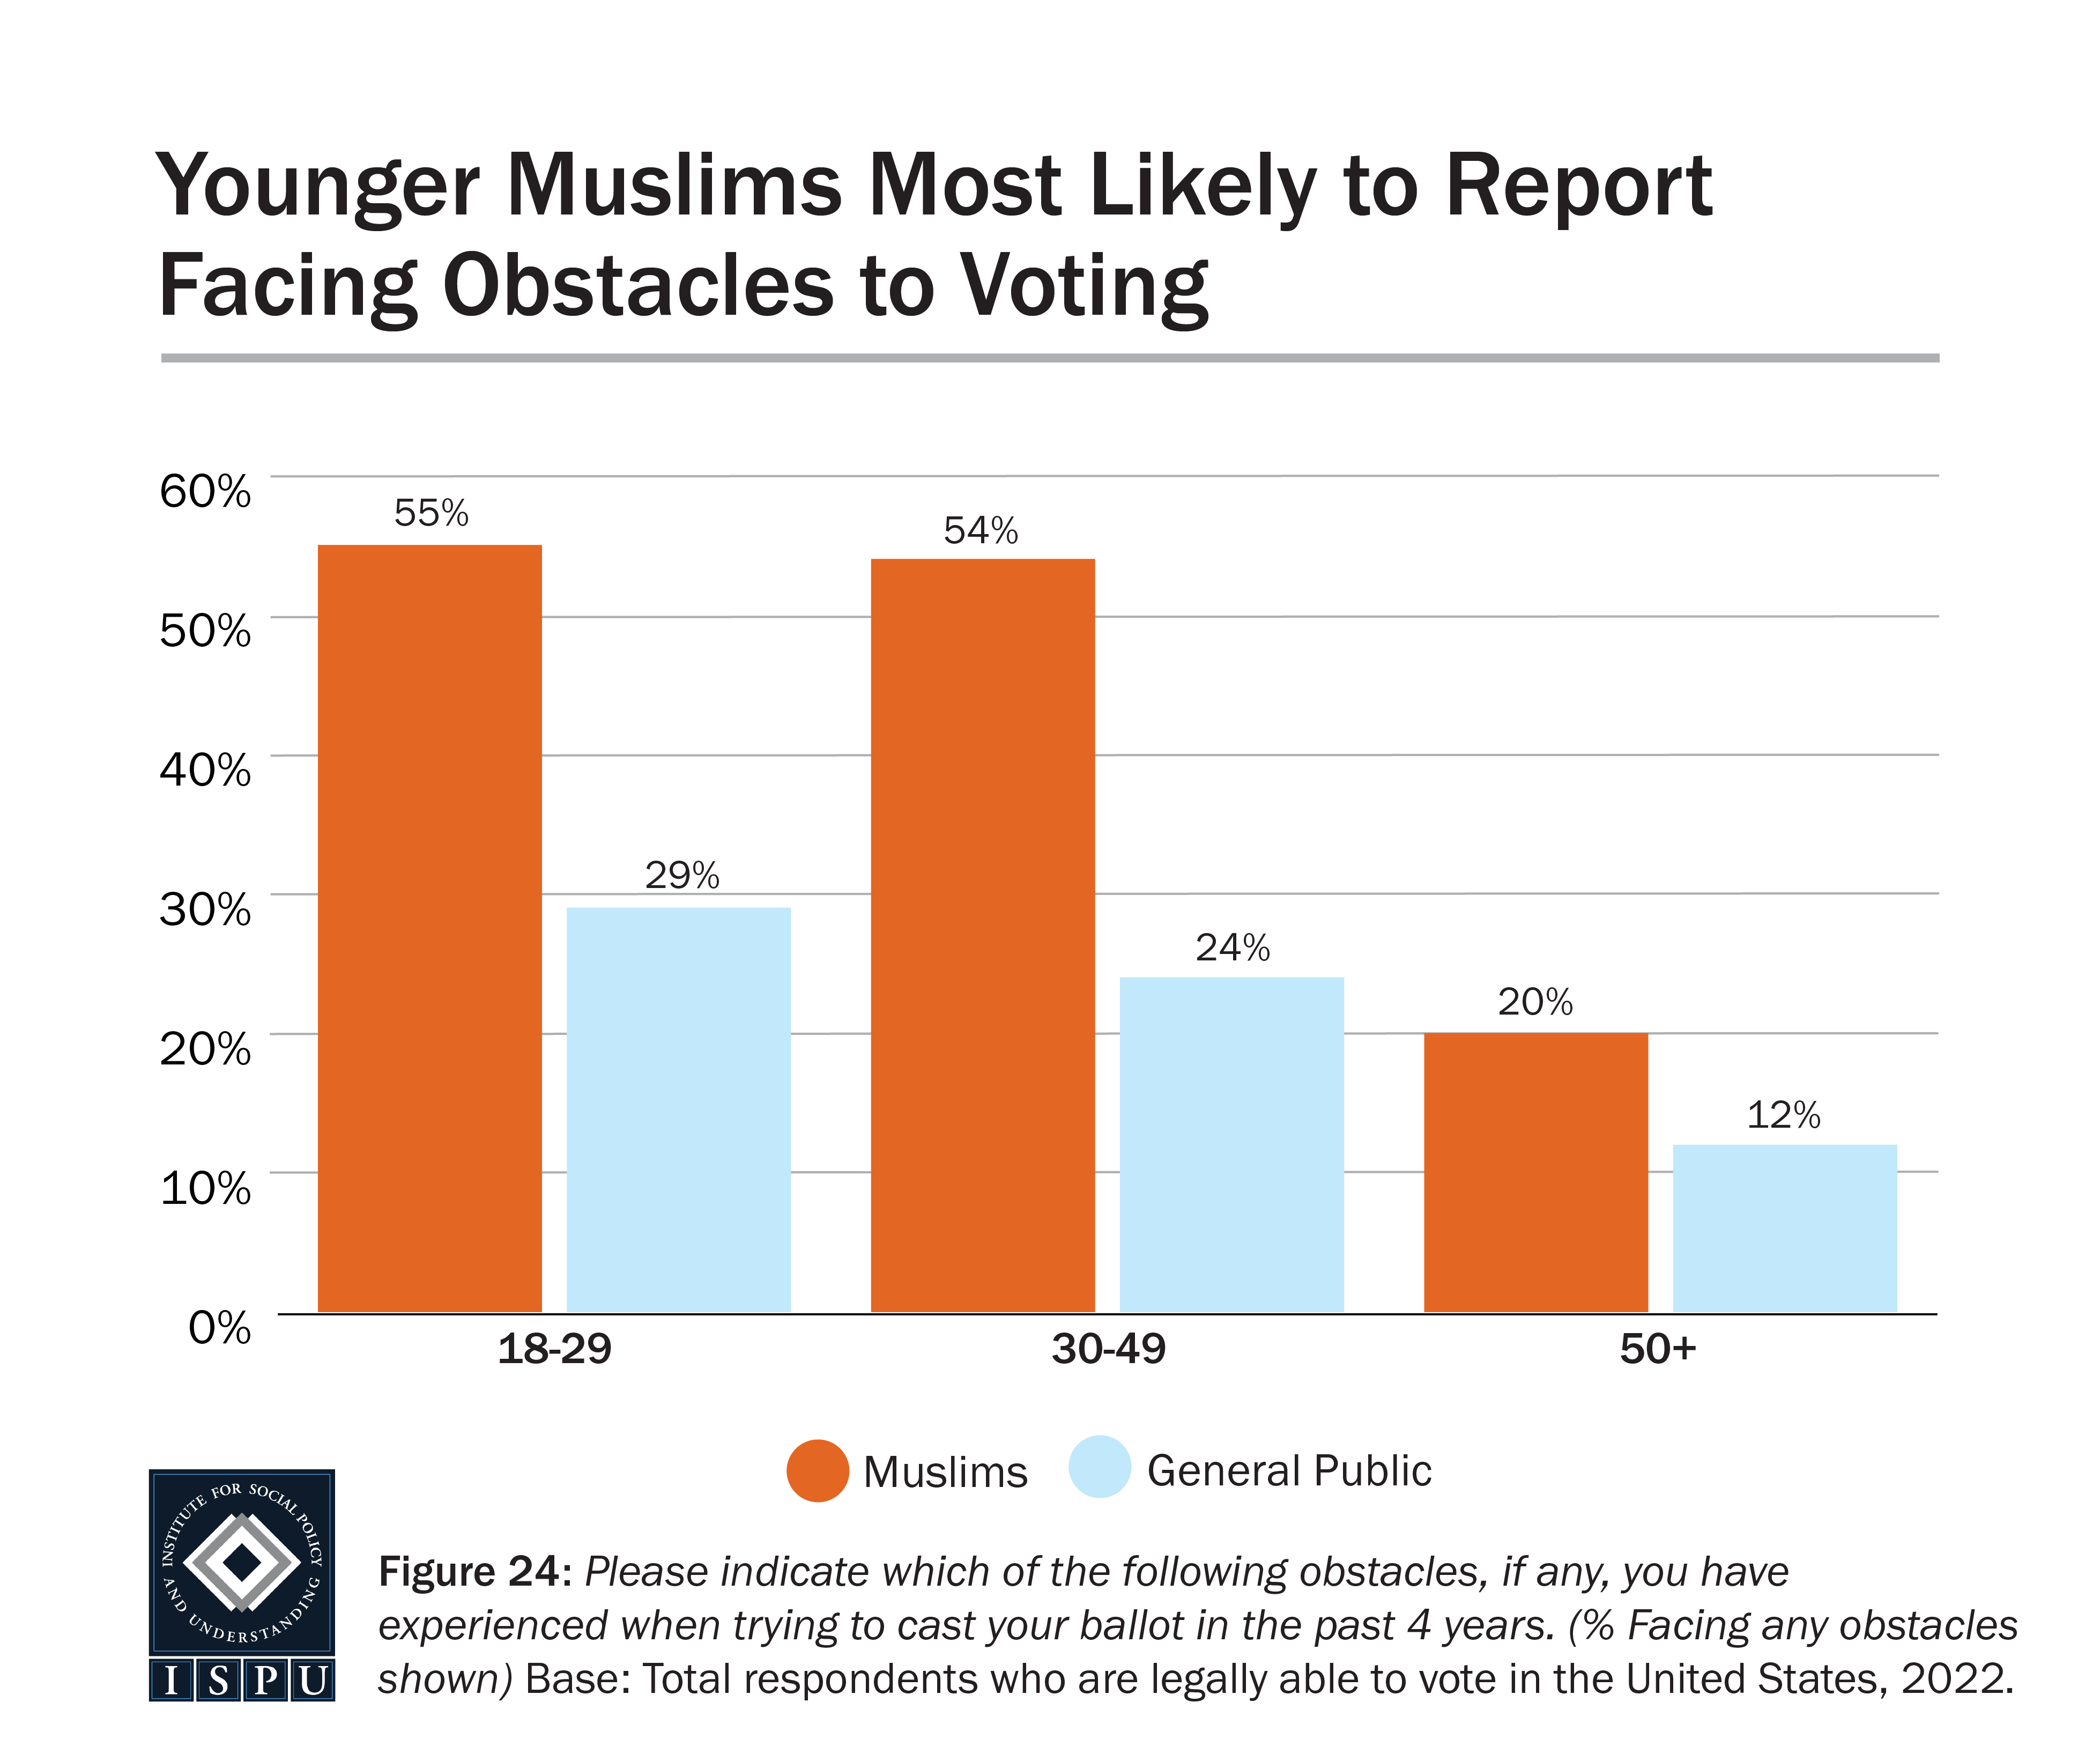
When examining the data by age, we find that for both Muslims and the general public, younger people were far more likely than older people to report facing obstacles to voting in the past four years. Among Muslims, roughly 55% of 18-29-year-olds and 30-49-year-olds reported facing obstacles, compared with 20% of 50+-year-olds.
Among the general public, roughly a quarter of the younger age groups reported facing obstacles, compared with 12% of the oldest age cohort. The oldest Muslims and members of the general public were on par in terms of the proportion who reported facing obstacles; however, 18-29-year-old and 30-49-year-old Muslims were more likely than their age counterparts in the general public to report facing obstacles to voting in the past four years.
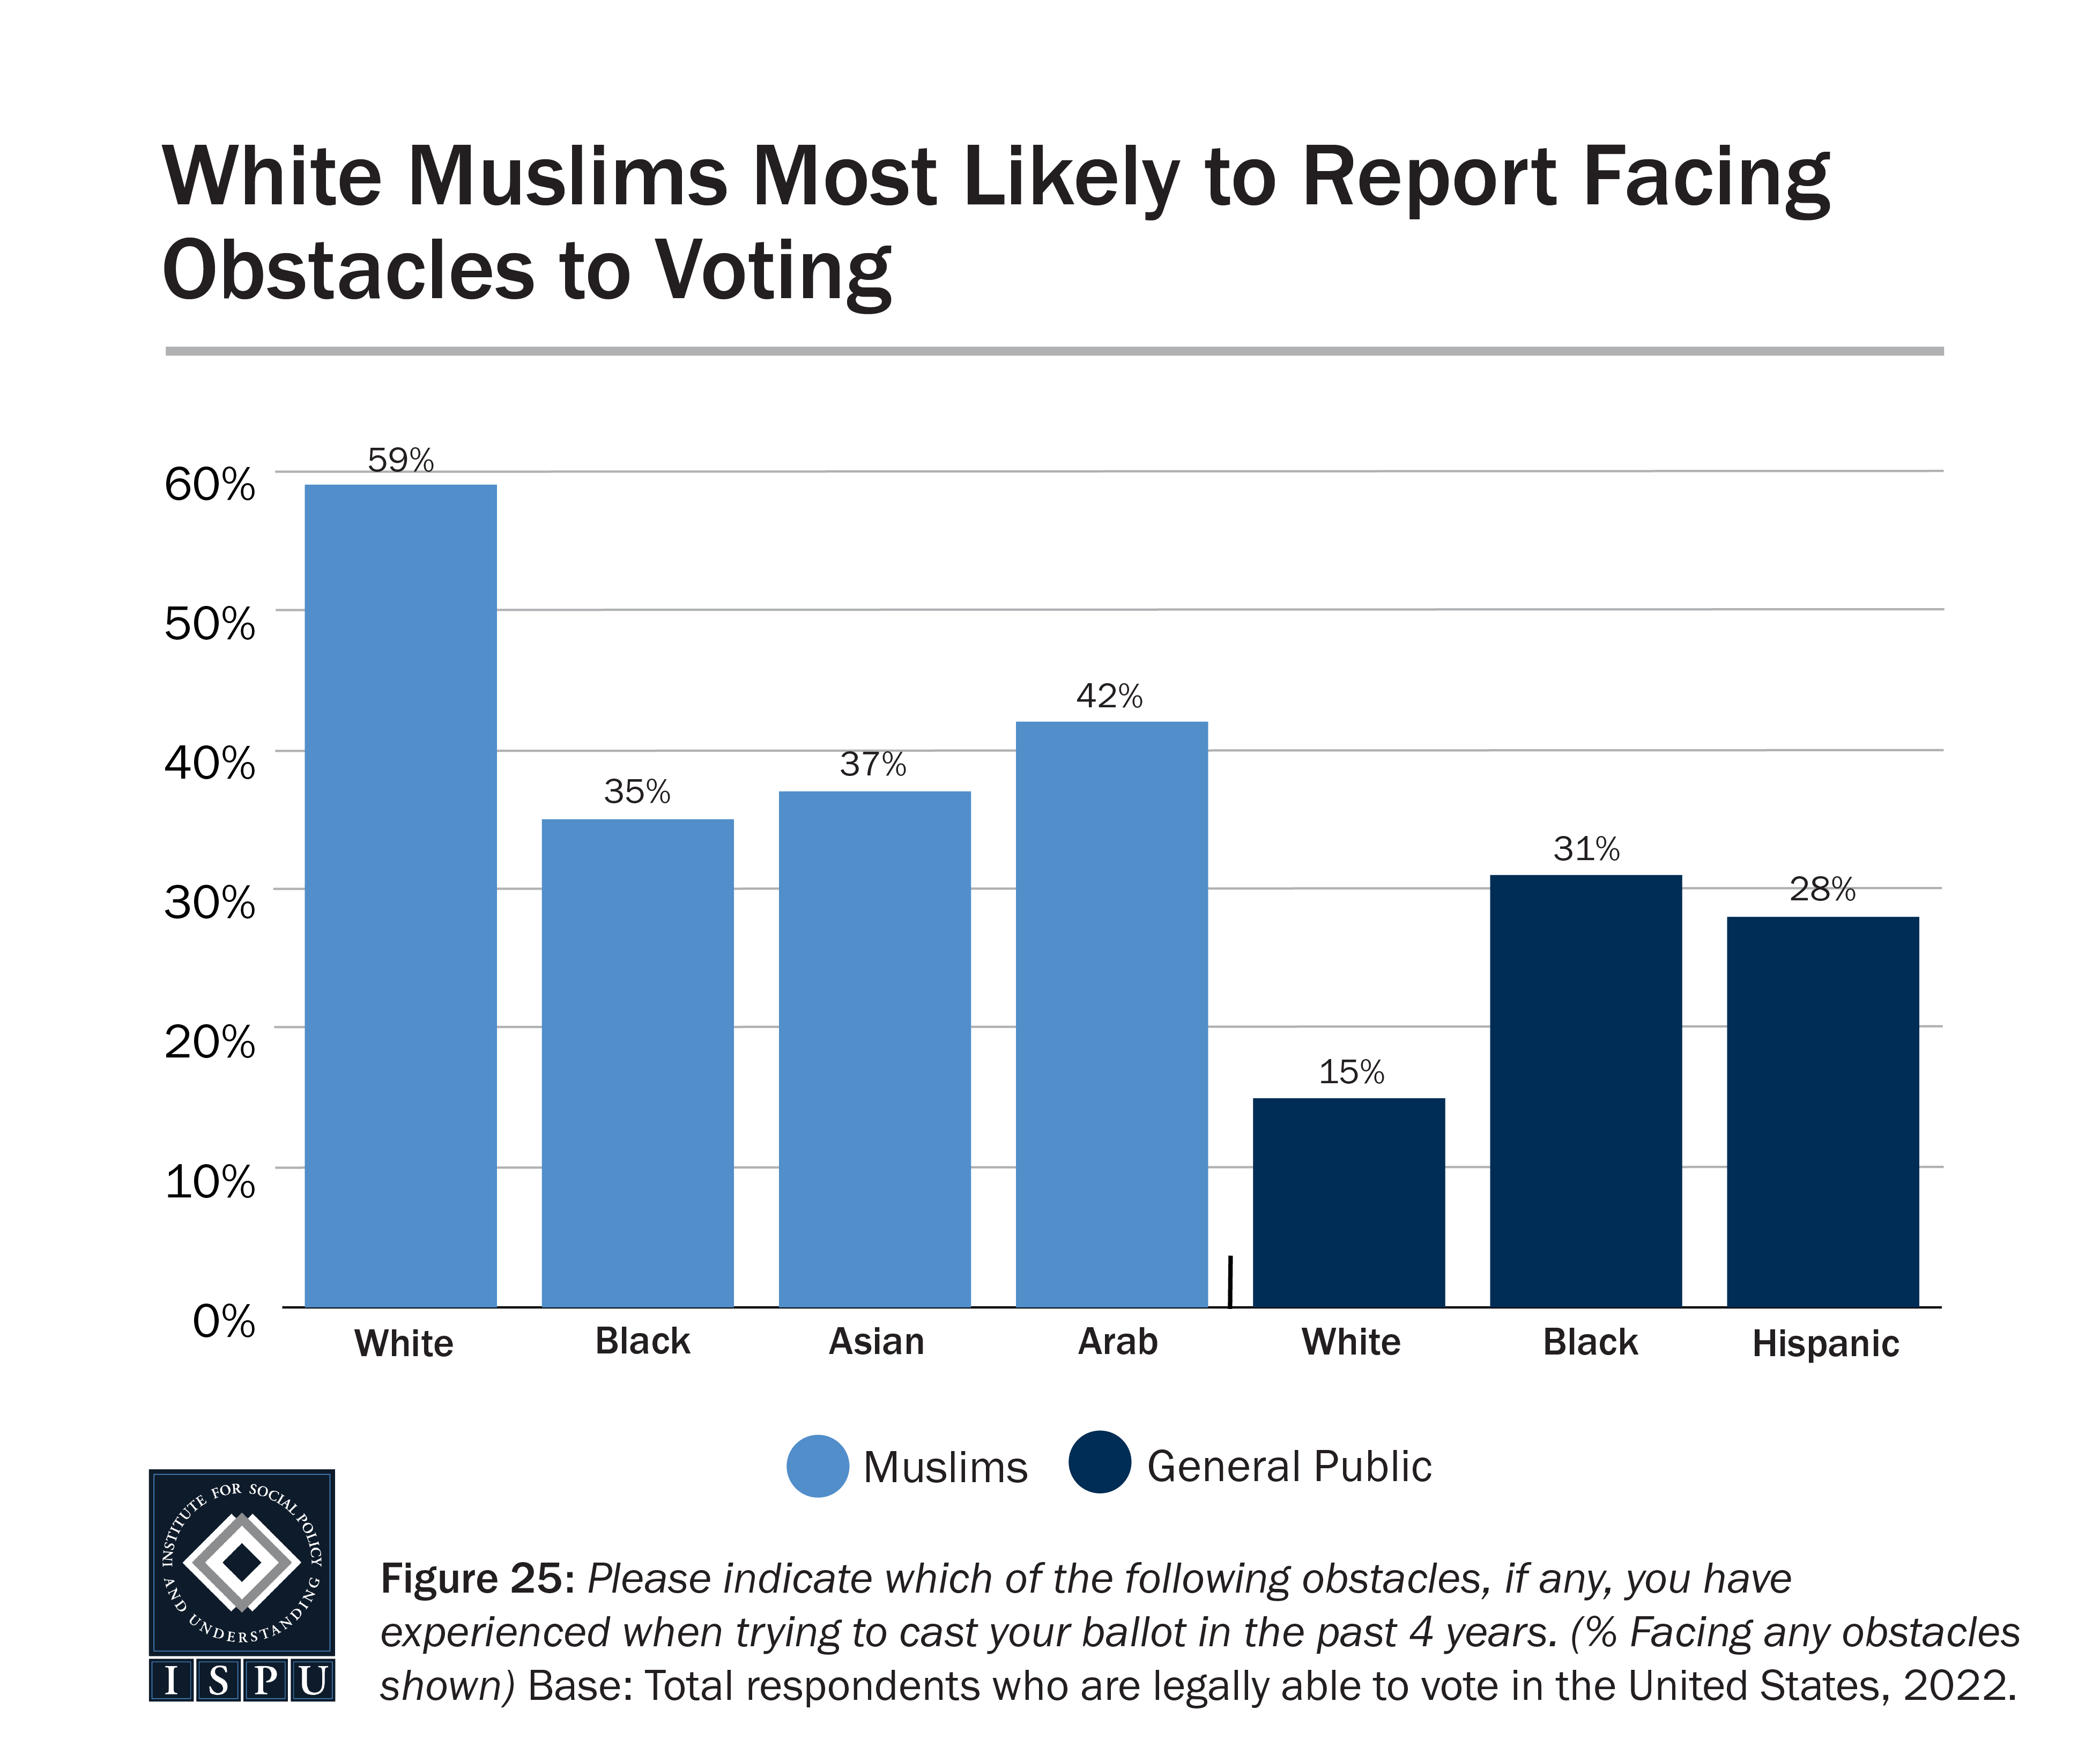
We also find racial/ethnic differences in reports of facing voting obstacles. Among Muslims, whites are more likely to report facing obstacles (59%), compared with Black (35%), Asian (37%), and Arab (42%) Muslim eligible voters. Among the general public, on the other hand, whites were least likely to report facing voting obstacles in the past four years (15%), compared with Black (31%) and Hispanic (28%) eligible voters.
Long Wait Times Most Frequently Cited Obstacle to Voting Among Muslims
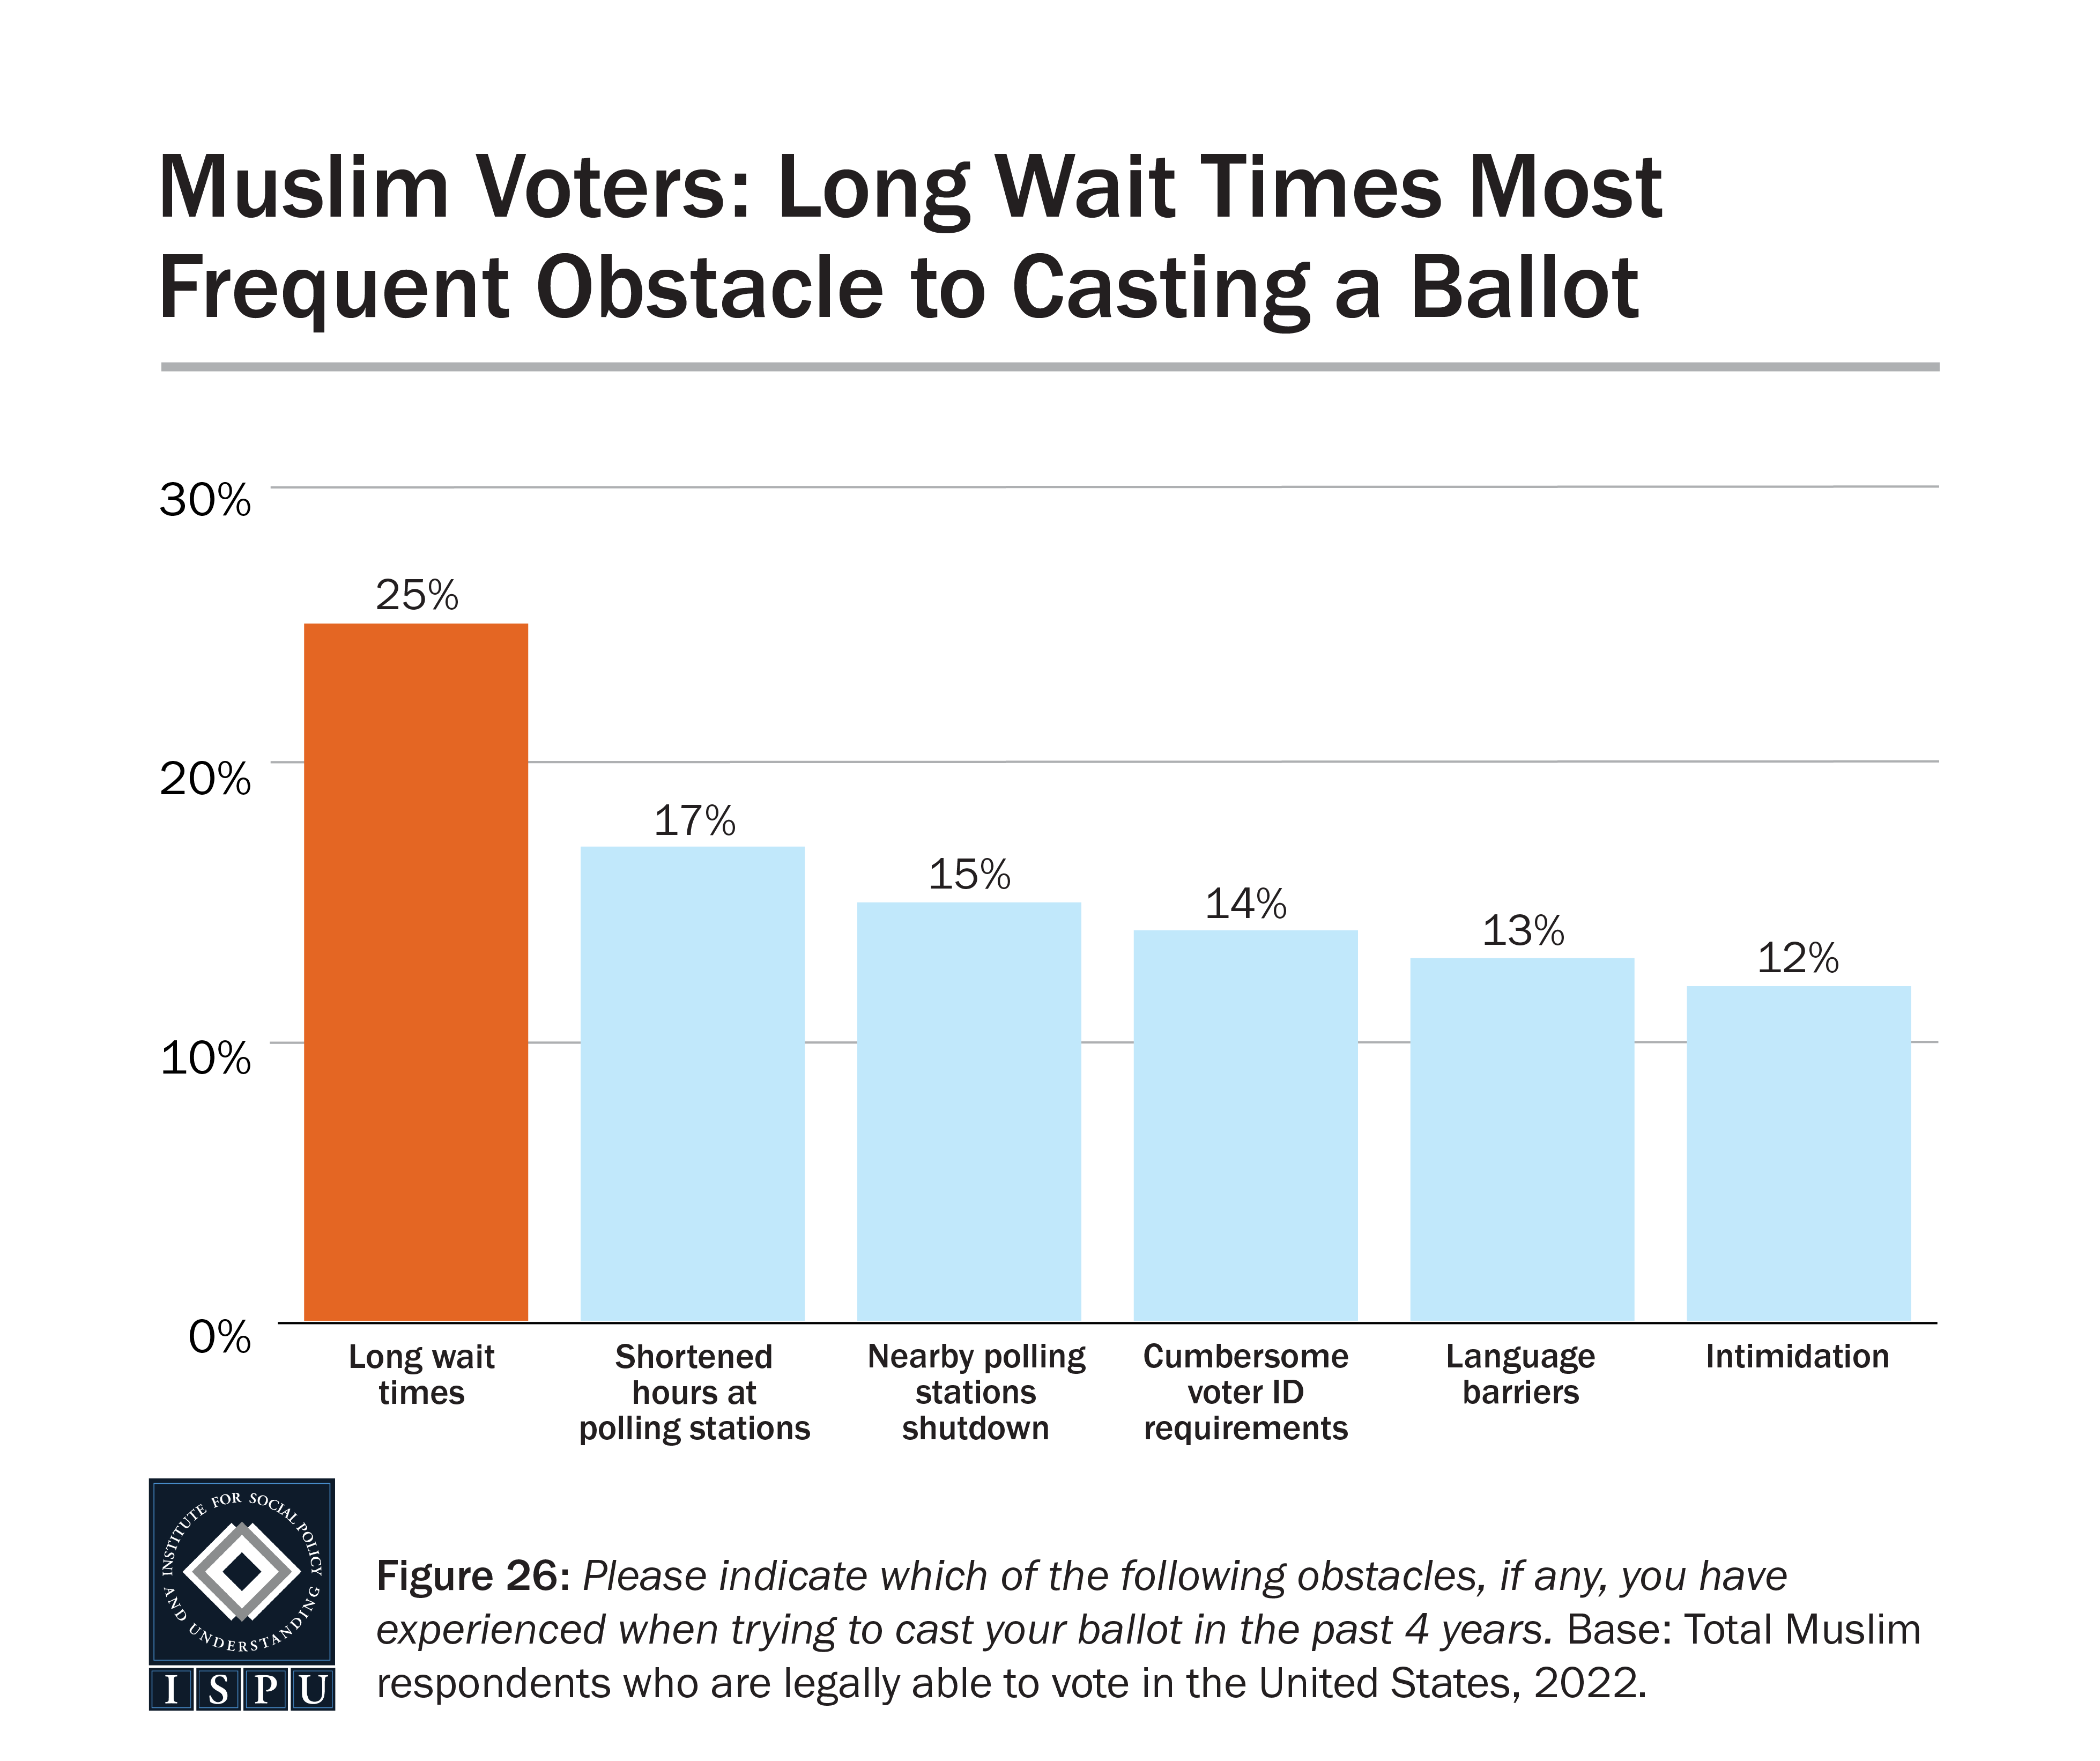
Looking at the particular obstacles faced, one in four Muslims eligible to vote reported facing ‘long wait times to cast a ballot’, the most frequent obstacle cited. While long wait times may seem like simply a nuisance, they are not as innocuous as they appear. Longer wait times are more often experienced by racial/ethnic minorities and poorer precincts and often reflect the lack of polling places, poll workers, and voting machines in these precincts. In other words, areas with higher concentrations of racial/ethnic minorities and poor people have fewer electoral resources. This is especially challenging as, for those with limited economic resources, long wait times can mean being forced to forgo voting at all if they cannot afford to take the day off work.
Other obstacles to voting among Muslims include: shortened poll hours (17%), nearby polling stations shutdown (15%), cumbersome voter ID requirements (14%), language barriers causing difficulty understanding ballot choices (13%), and facing intimidation (12%).
Obstacles to Voting Linked to Higher Intention to Vote for Muslims
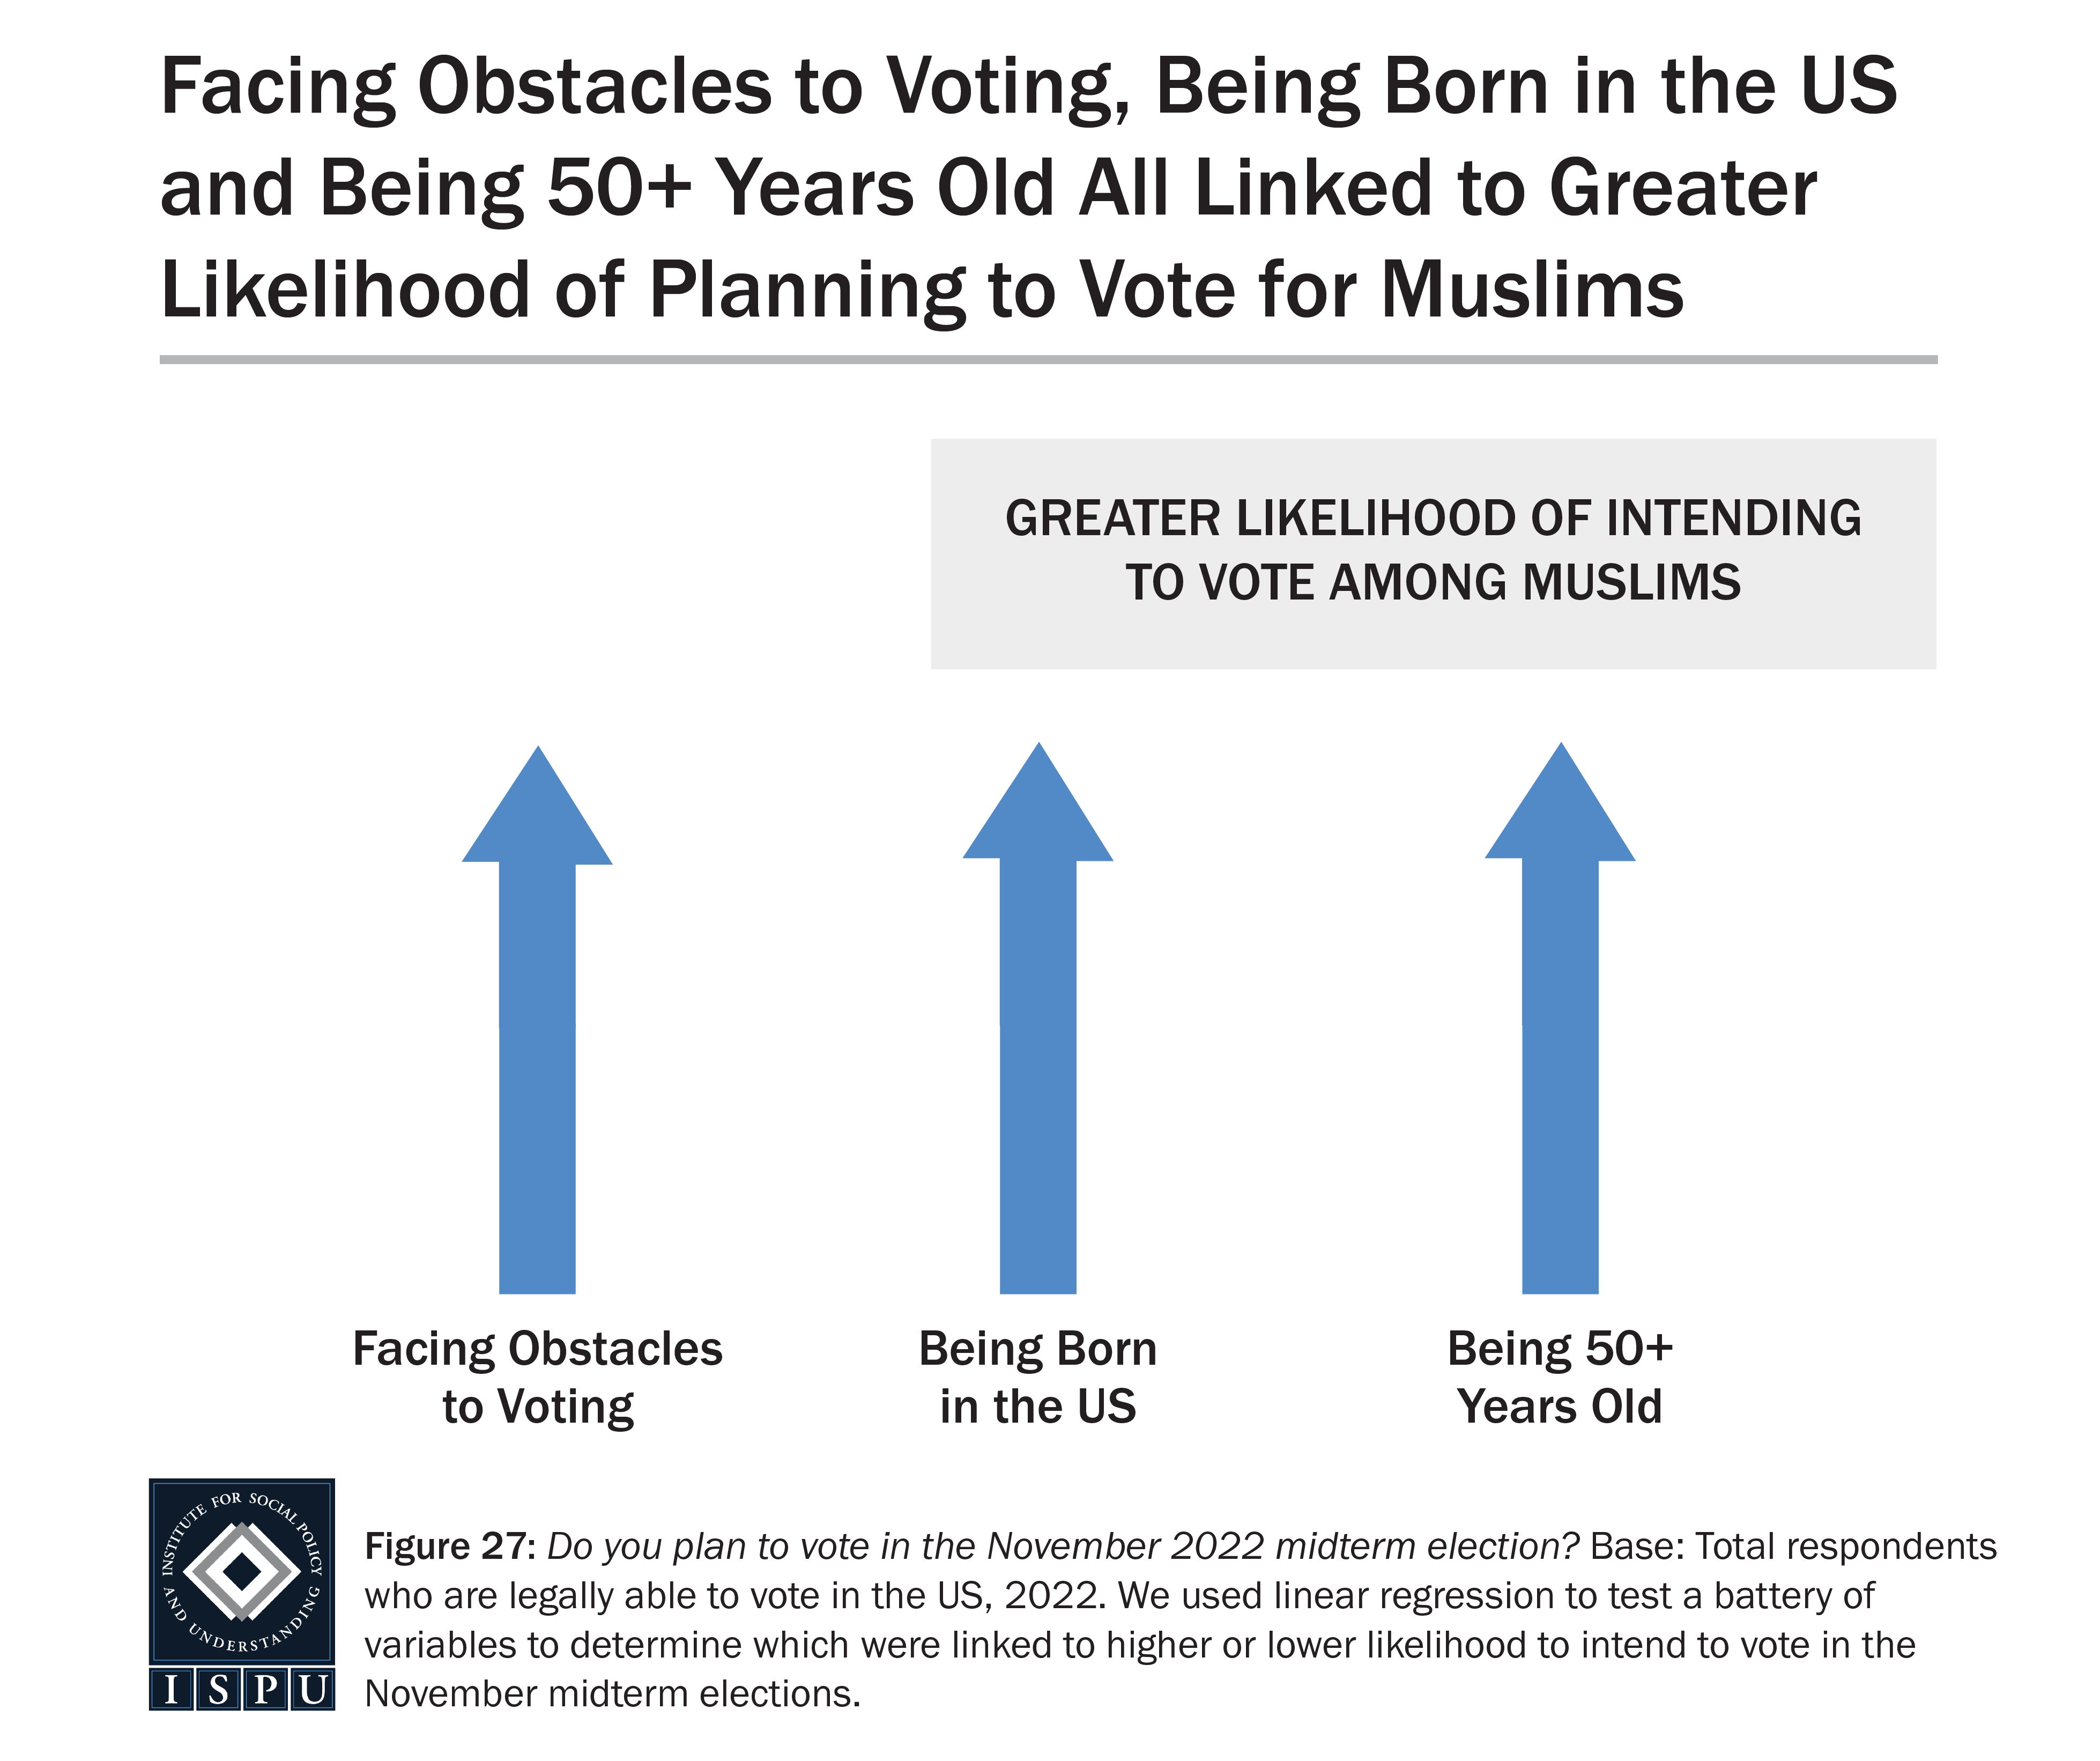
With American Muslims nearly twice as likely as the general public to report facing obstacles to voting over the past four years, we then asked: Does experiencing obstacles impact intention to vote? In order to get answers to this question, we ran a linear regression model to examine factors that predict one’s intention to vote in the 2022 midterm elections. We find that having faced obstacles to voting in the past four years, being born in the US (vs. being foreign born) and being 50+ years old (compared with 18-29 years old) are all associated with a greater likelihood of intending to vote among Muslims. Education and income did not make a difference for Muslims, unlike other groups as illustrated below. This suggests that nativity and age make a bigger difference on Muslim voting patterns than does education and points to the need for greater outreach to younger Muslims and immigrant communities.
Among Jewish Americans, only having a college degree (vs. not) was associated with a greater likelihood of intending to vote in the 2022 midterm elections. Among the general public, the following factors were significantly associated with a higher likelihood of intending to vote: having faced obstacles to voting the past four years, being US born (vs. foreign born), being 50+ years old (vs. 18-29 years old), having a high income (vs. all other income levels), and having a college degree (vs. not).
Muslims as Likely to Identify as Democrats as Independents
In terms of political party affiliation, the plurality of Muslims identify as Democrats. At 46%, Muslims are as likely as Jews (45%) and the nonaffiliated (40%) to identify as Democrats, and more likely than Catholics (35%), Protestants (25%), white Evangelicals (6%), and the general public (32%). Muslims are by far the most likely group to identify as Independents (40%), higher than Jews (32%), Catholics (26%), Protestants (17%), white Evangelicals (19%), the nonaffiliated (26%), and the general public (24%). Only 10% of Muslims identify as Republicans, on par with 11% of the nonaffiliated but lower than all other groups, including 18% of Jews, 29% of Catholics, 42% of Protestants, 69% of white Evangelicals, and 28% of the general public.
Interestingly, while there are some gender differences in political party affiliation for other groups surveyed, there are no gender differences among Muslims. Women are more likely than men to identify as Democrats among Catholics (44% vs. 25%), Protestants (30% vs. 16%), and the general public (38% vs. 26%). There are no gender differences among any group surveyed when it comes to identifying as Independent or Republican.
Among Muslims, there are no age differences when it comes to identifying as a Republican. However, when it comes to identifying as a Democrat or Independent, 18-29-years-olds are more likely than 30-49-year-olds to identify as Independent (49% vs. 33%, respectively) and less likely to identify as Democrats (39% of 18-29-year-olds vs. 51% of 30-49-year-olds).
The large politically independent segment among Muslims suggests that many in this community make voting decisions based more on changing policy issues and less along fixed partisan lines, opening an opportunity to both parties to win Muslim support. It also suggests that many Muslims don’t identify with either party’s platform in full. When it comes to hot button issues that usually fall along partisan lines, Muslims are often split with only a slight majority favoring the more traditionally Democratic position (gun safety, abortion, addressing climate change, etc.) as we will see later in this report. Yet, despite a significant minority of Muslims favoring a more conservative position, no more than 10% identify as Republican, suggesting the GOP could win over a larger share of the Muslim vote if it mitigated anti-Muslim rhetoric and policies among its ranks.
The large politically independent segment among Muslims suggests that many in this community make voting decisions based more on changing policy issues and less along fixed partisan lines.
Hot Button Issues: Muslims More Similar to Nonaffiliated and Jewish Americans than Evangelicals on Hot Button Social Issues
Given that midterm elections will take place later this year and with our nation being so polarized, we included new questions in the American Muslim Poll 2022 to gauge opinions about hot button issues.
Ahead of this report, ISPU released a number of data points early to inform important national conversations as they unfolded. These included:
-
- COVID-19 Vaccines: Black Muslims and Younger Muslims Least Likely to be Vaccinated
- In April 2022, as the nation emerged from a winter COVID surge into a “new normal” of living with the pandemic, ISPU published updated data on vaccine uptake and reasons for vaccine hesitancy. We found that Black Muslims and younger Muslims were least likely to be vaccinated and that the most common reason for vaccine hesitancy cited by Muslims is lack of trust in vaccines generally.
- Abortion: Most American Muslims Think Abortion Should Be Legal
- After the draft SCOTUS opinion overturning Roe v. Wade was leaked in early May, ISPU released poll data on this topic. We found that the majority of American Muslims believe that abortion should be legal in all or most cases.
- Firearms: The Majority of Muslims Favor More Strict Laws Covering the Sale of Firearms
- After the tragic school shooting in late May at Robb Elementary in Uvalde, TX, ISPU published poll data in June on American Muslim views about laws covering the sale of firearms. We found that the majority of American Muslims say laws covering the sale of firearms should be stricter.
- COVID-19 Vaccines: Black Muslims and Younger Muslims Least Likely to be Vaccinated
Climate Change: Muslims among the Most Likely Group to See Climate Change as the Result of Human Behavior and Favor Government Regulation to Curb Its Impact
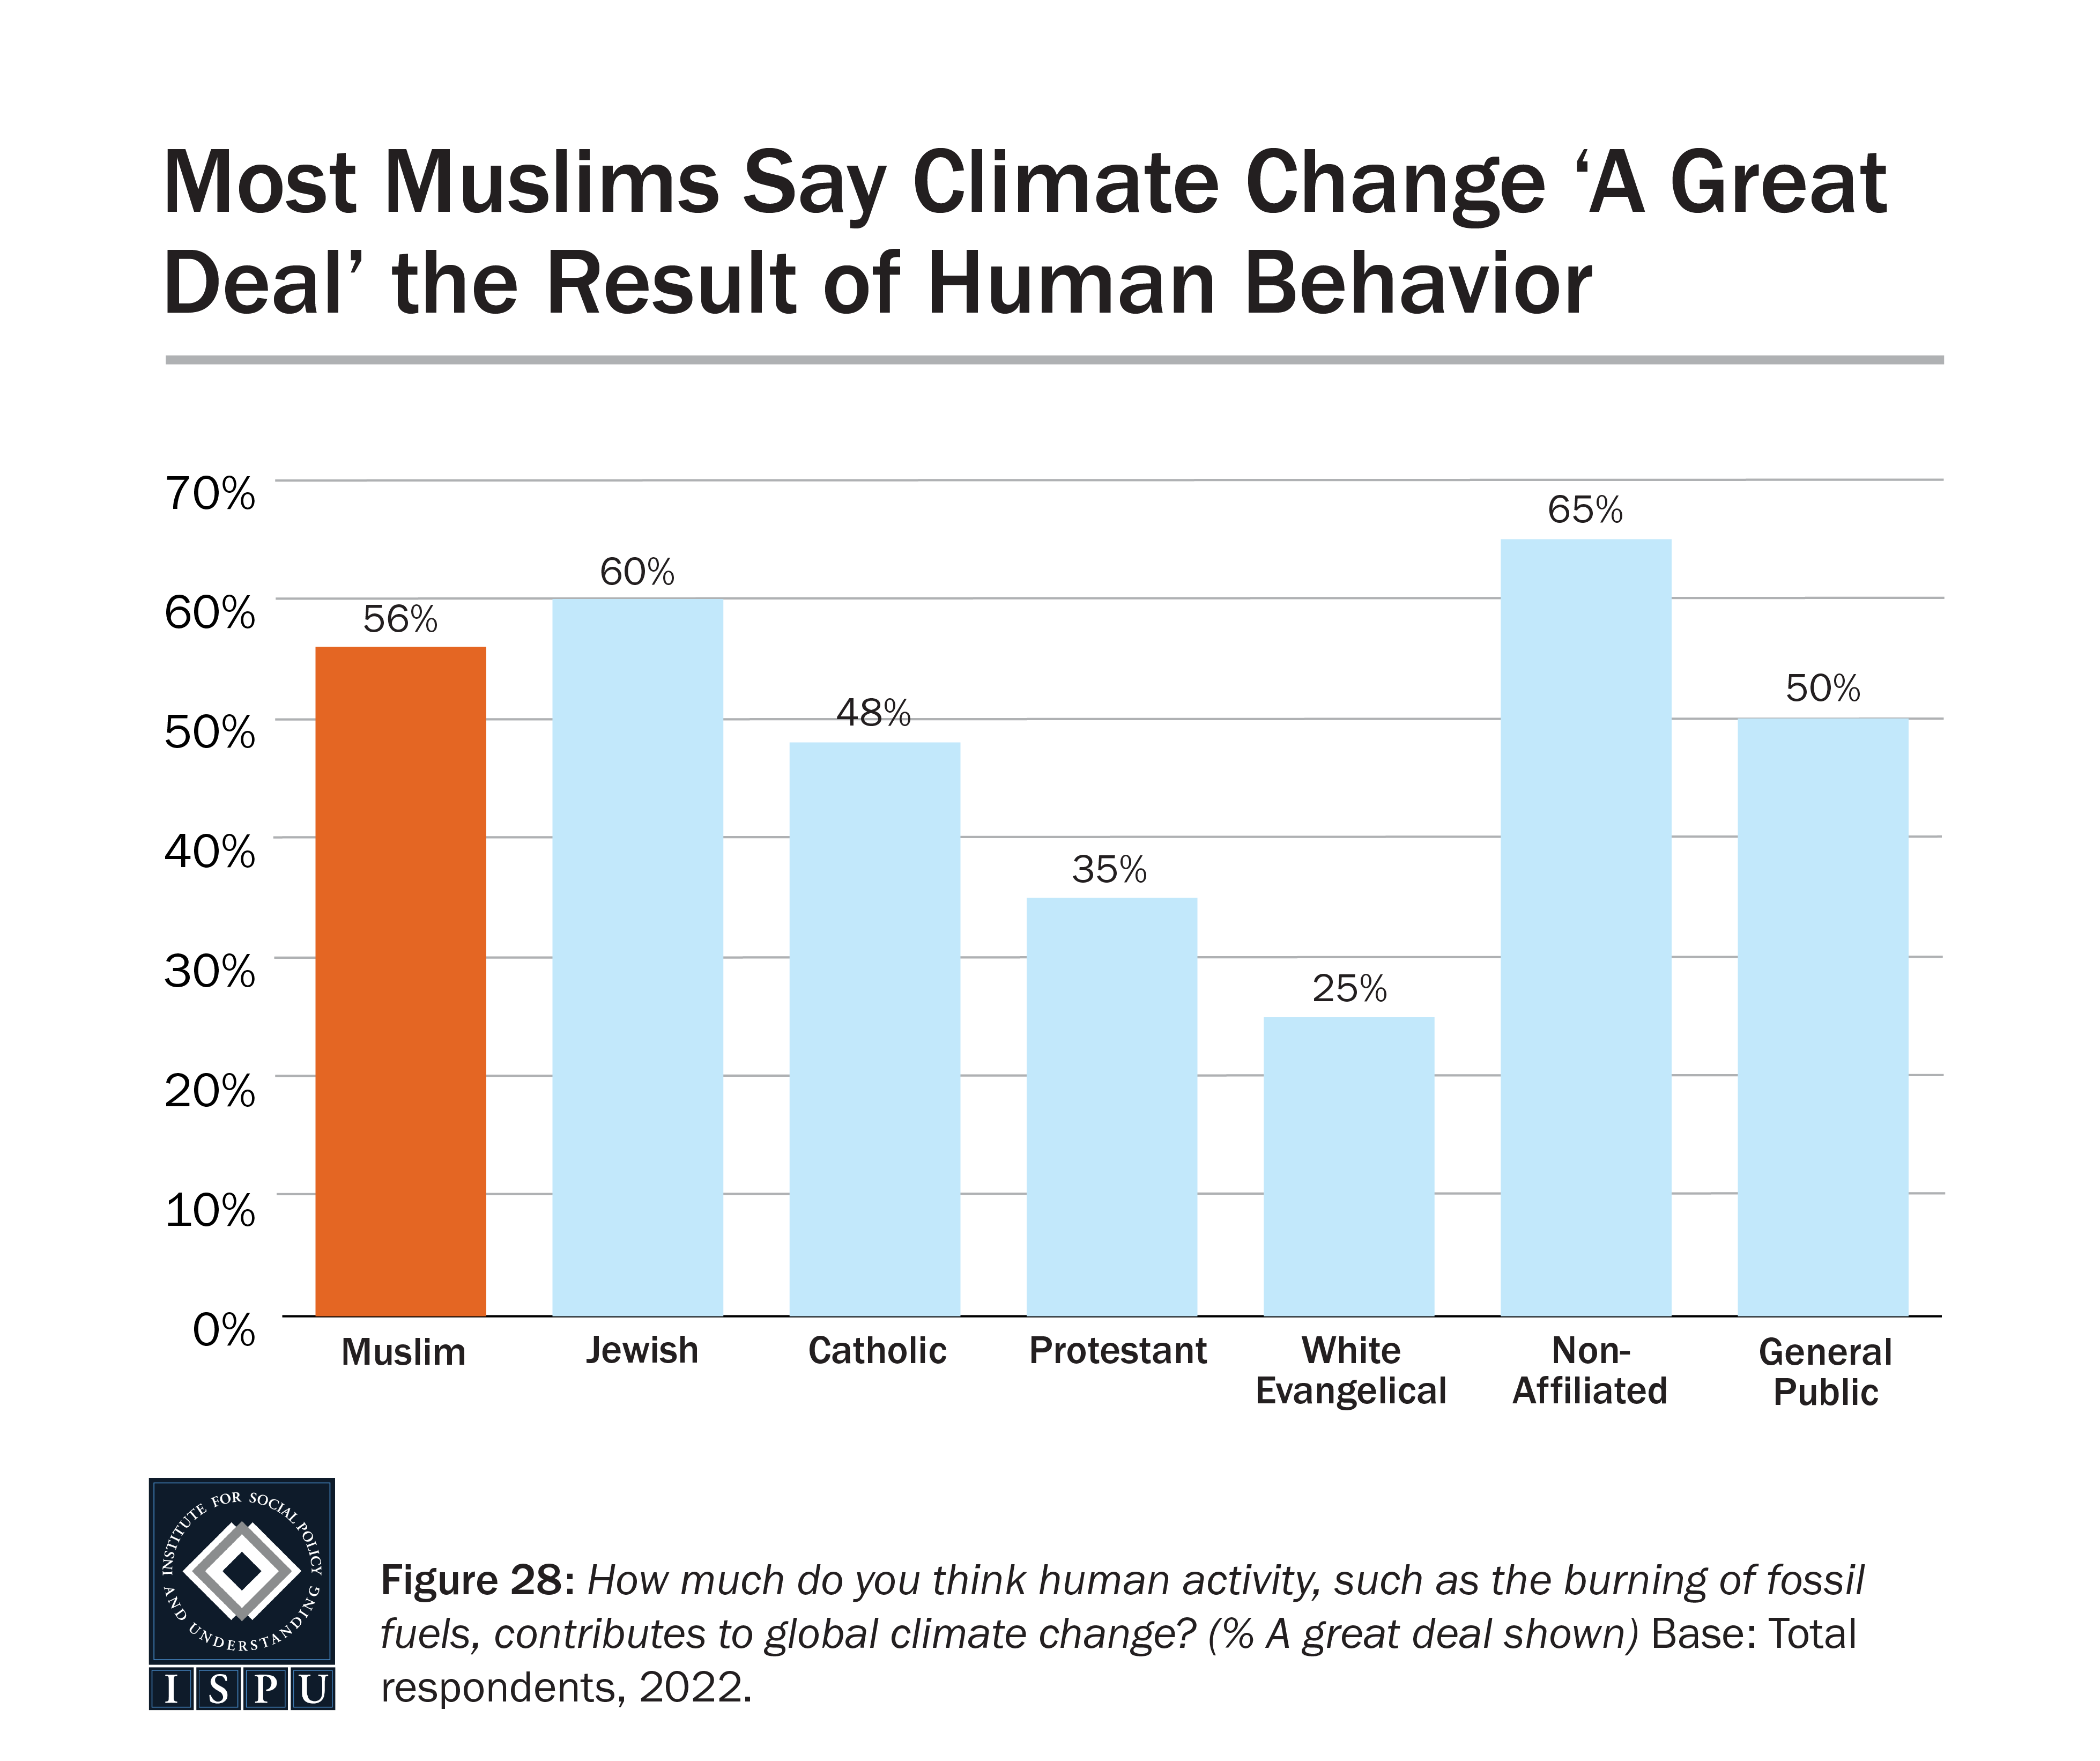
Muslims are among the most likely to attribute climate change to human activity. More than half of Muslims (56%), along with 60% of Jews, 48% of Catholics, and 65% of the nonaffiliated see climate change as ‘a great deal’ the result of human behavior, compared with 35% of Protestants and 25% of white Evangelicals. Half of the general public (50%) says climate change is ‘a great deal’ the result of human behavior, slightly less likely than American Muslims. Men and women of all groups are equally likely to hold this view.
One quarter of white Evangelicals (25%) hold the view that climate change is ‘not at all’ the result of human behavior. This is more likely than 7% of Muslims, 10% of Jews, 6% of Catholics, 14% of Protestants, 4% of the nonaffiliated, and 8% of the general public.
Among American Muslims, all age groups were equally likely to express that climate change is ‘a great deal’ the result of human behavior (59% of 18-29-year-olds, 57% of 30-49-year-olds, and 47% of 50+-year-olds). Among the general public, however, the oldest (50+-year-olds) were less likely than younger age groups to hold this view (41% of 50+-year-olds vs. 63% of 18-29-year-olds and 53% of 30-49-year-olds).
Looking at the data by race/ethnicity among American Muslims, we find Black Muslims are less likely than Asian Muslims to believe climate change is ‘a great deal’ the result of human behavior (46% vs. 67%, respectively). More than half (57%) of both white and Arab Muslims hold this view. Furthermore, Black Muslims are more likely than white and Asian Muslims to believe climate change is ‘not at all’ the result of human behavior (13% vs. 5% and 1%, respectively). Three percent of Arab Muslims believe climate change is unrelated to human behavior. When comparing between Muslims and the general public, Black Muslims are as likely as Black Americans in the general public to believe climate change is ‘a great deal’ related to human behavior (46% and 52%, respectively); however, Black Muslims are more likely than Black Americans in the general public to believe climate change is ‘not at all’ related to human behavior (13% vs. 3%, respectively).
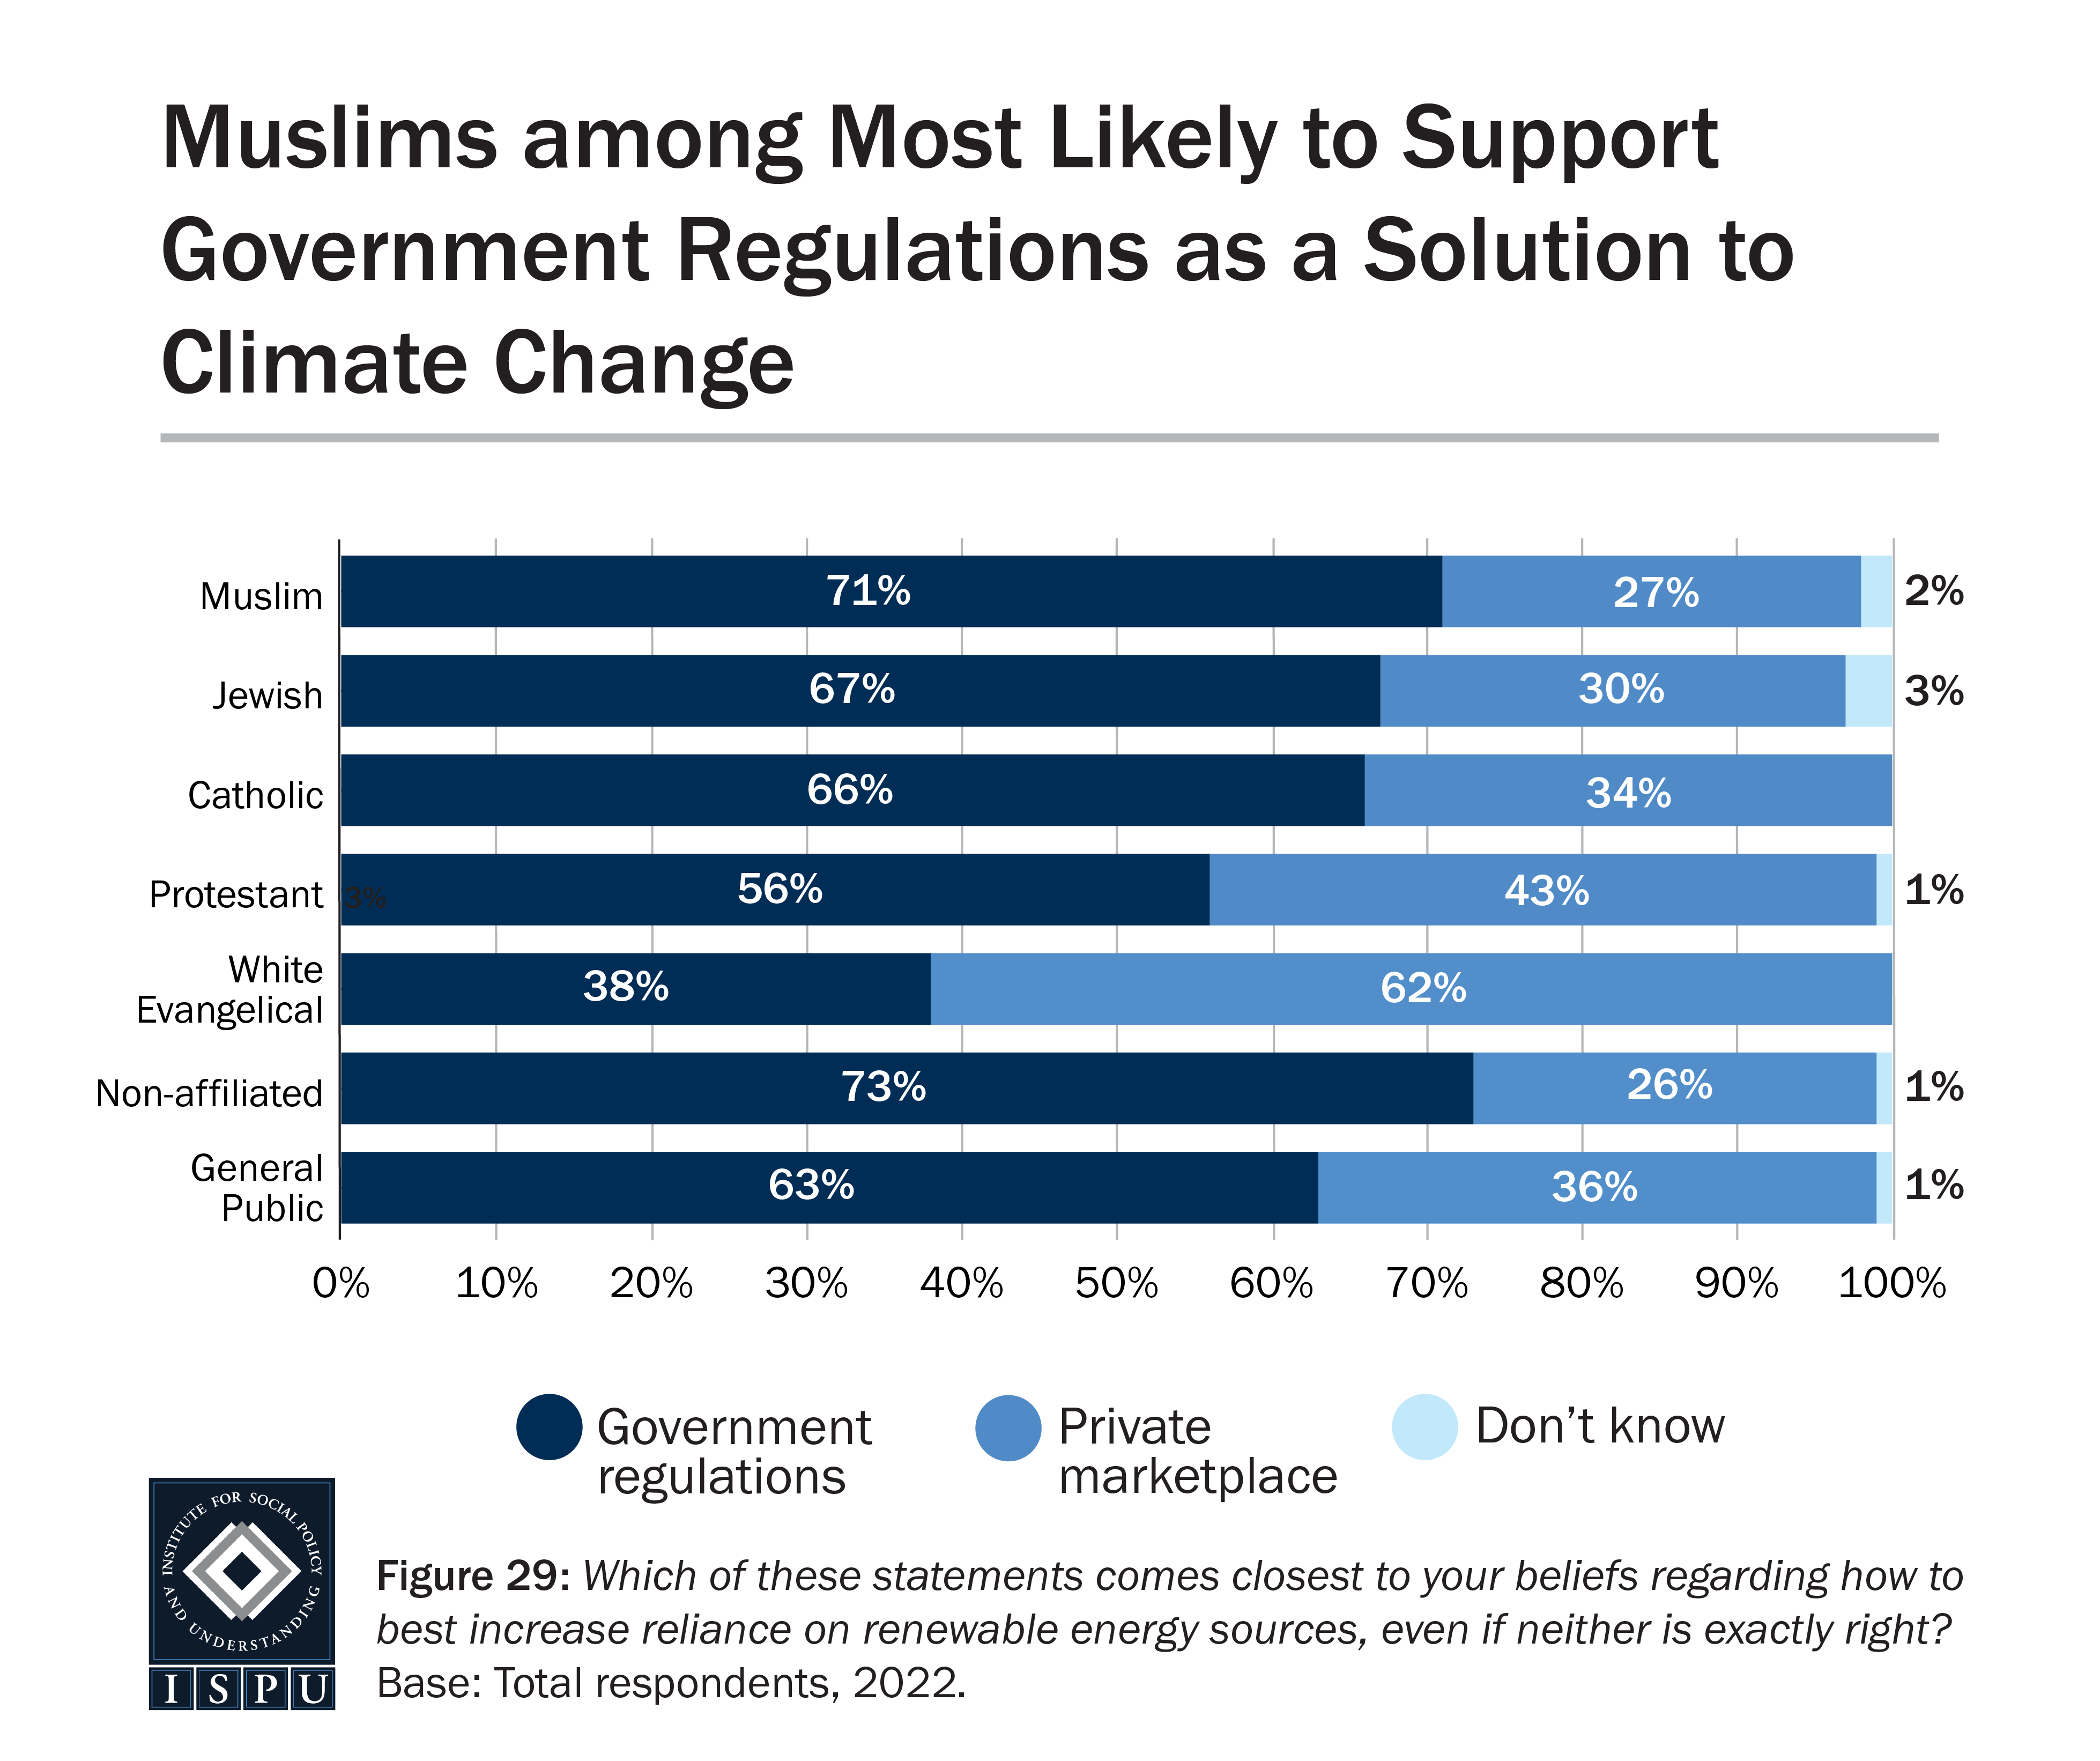
When it comes to solutions to climate change, we find a similar pattern as found above about the causes of climate change. Specifically, Muslims are among the most supportive of government regulations to encourage reliance on renewable energy (71%), on par with roughly two-thirds of both Jews and Catholics. On the other hand, 56% of Protestants, 38% of white Evangelicals, and 63% of the general public believe that government regulations encouraging reliance on renewable energy are the solution to climate change. At 62%, white Evangelicals are most likely to believe the private marketplace is the solution to encourage reliance on renewable energy sources.
Americans Muslims of all ages are equally likely to believe that government regulations are needed to increase reliance on renewable energy sources. However, the oldest Muslims (50+ years old) are more likely than their age counterparts in the general public to hold this view (76% of 50+-year-old Muslims vs. 58% of 50+-year-olds in the general public). American Muslims aged 30-49 are more likely than 50+-year-old Muslims to believe the private marketplace will ensure reliance on renewable energy (34% vs. 18%, respectively).
Looking by race, we find Asian Muslims are more likely than white Muslims to believe in government regulations to encourage reliance on renewable energy (82% vs. 68%, respectively), while white Muslims are more likely than Asians Muslims to believe the private marketplace can mitigate the impact of climate change (30% vs. 18%). Among the general public, white Americans (57%) are less likely than Black (72%) and Hispanic (76%) Americans to believe in government regulations as a solution to climate change and are more likely to support the private marketplace as a solution (43% of white Americans vs. 27% of Black and 24% of Hispanic Americans). White Muslims are more likely than white Americans in the general public to support government regulation (68% vs. 57%, respectively).
Critical Race Theory (CRT): The Majority of Muslims Familiar with CRT Support Its Understood Principles
Muslims are overall among the most likely of any group studied to favor ideas and movements associated with racial equity. Muslims are the most likely to support Black Lives Matter of any faith group studied, according to American Muslim Poll 2020 and American Muslim Poll 2017. Though less likely to be familiar with CRT than other faith groups, those familiar with the theory are more likely than other groups to be in favor of it.
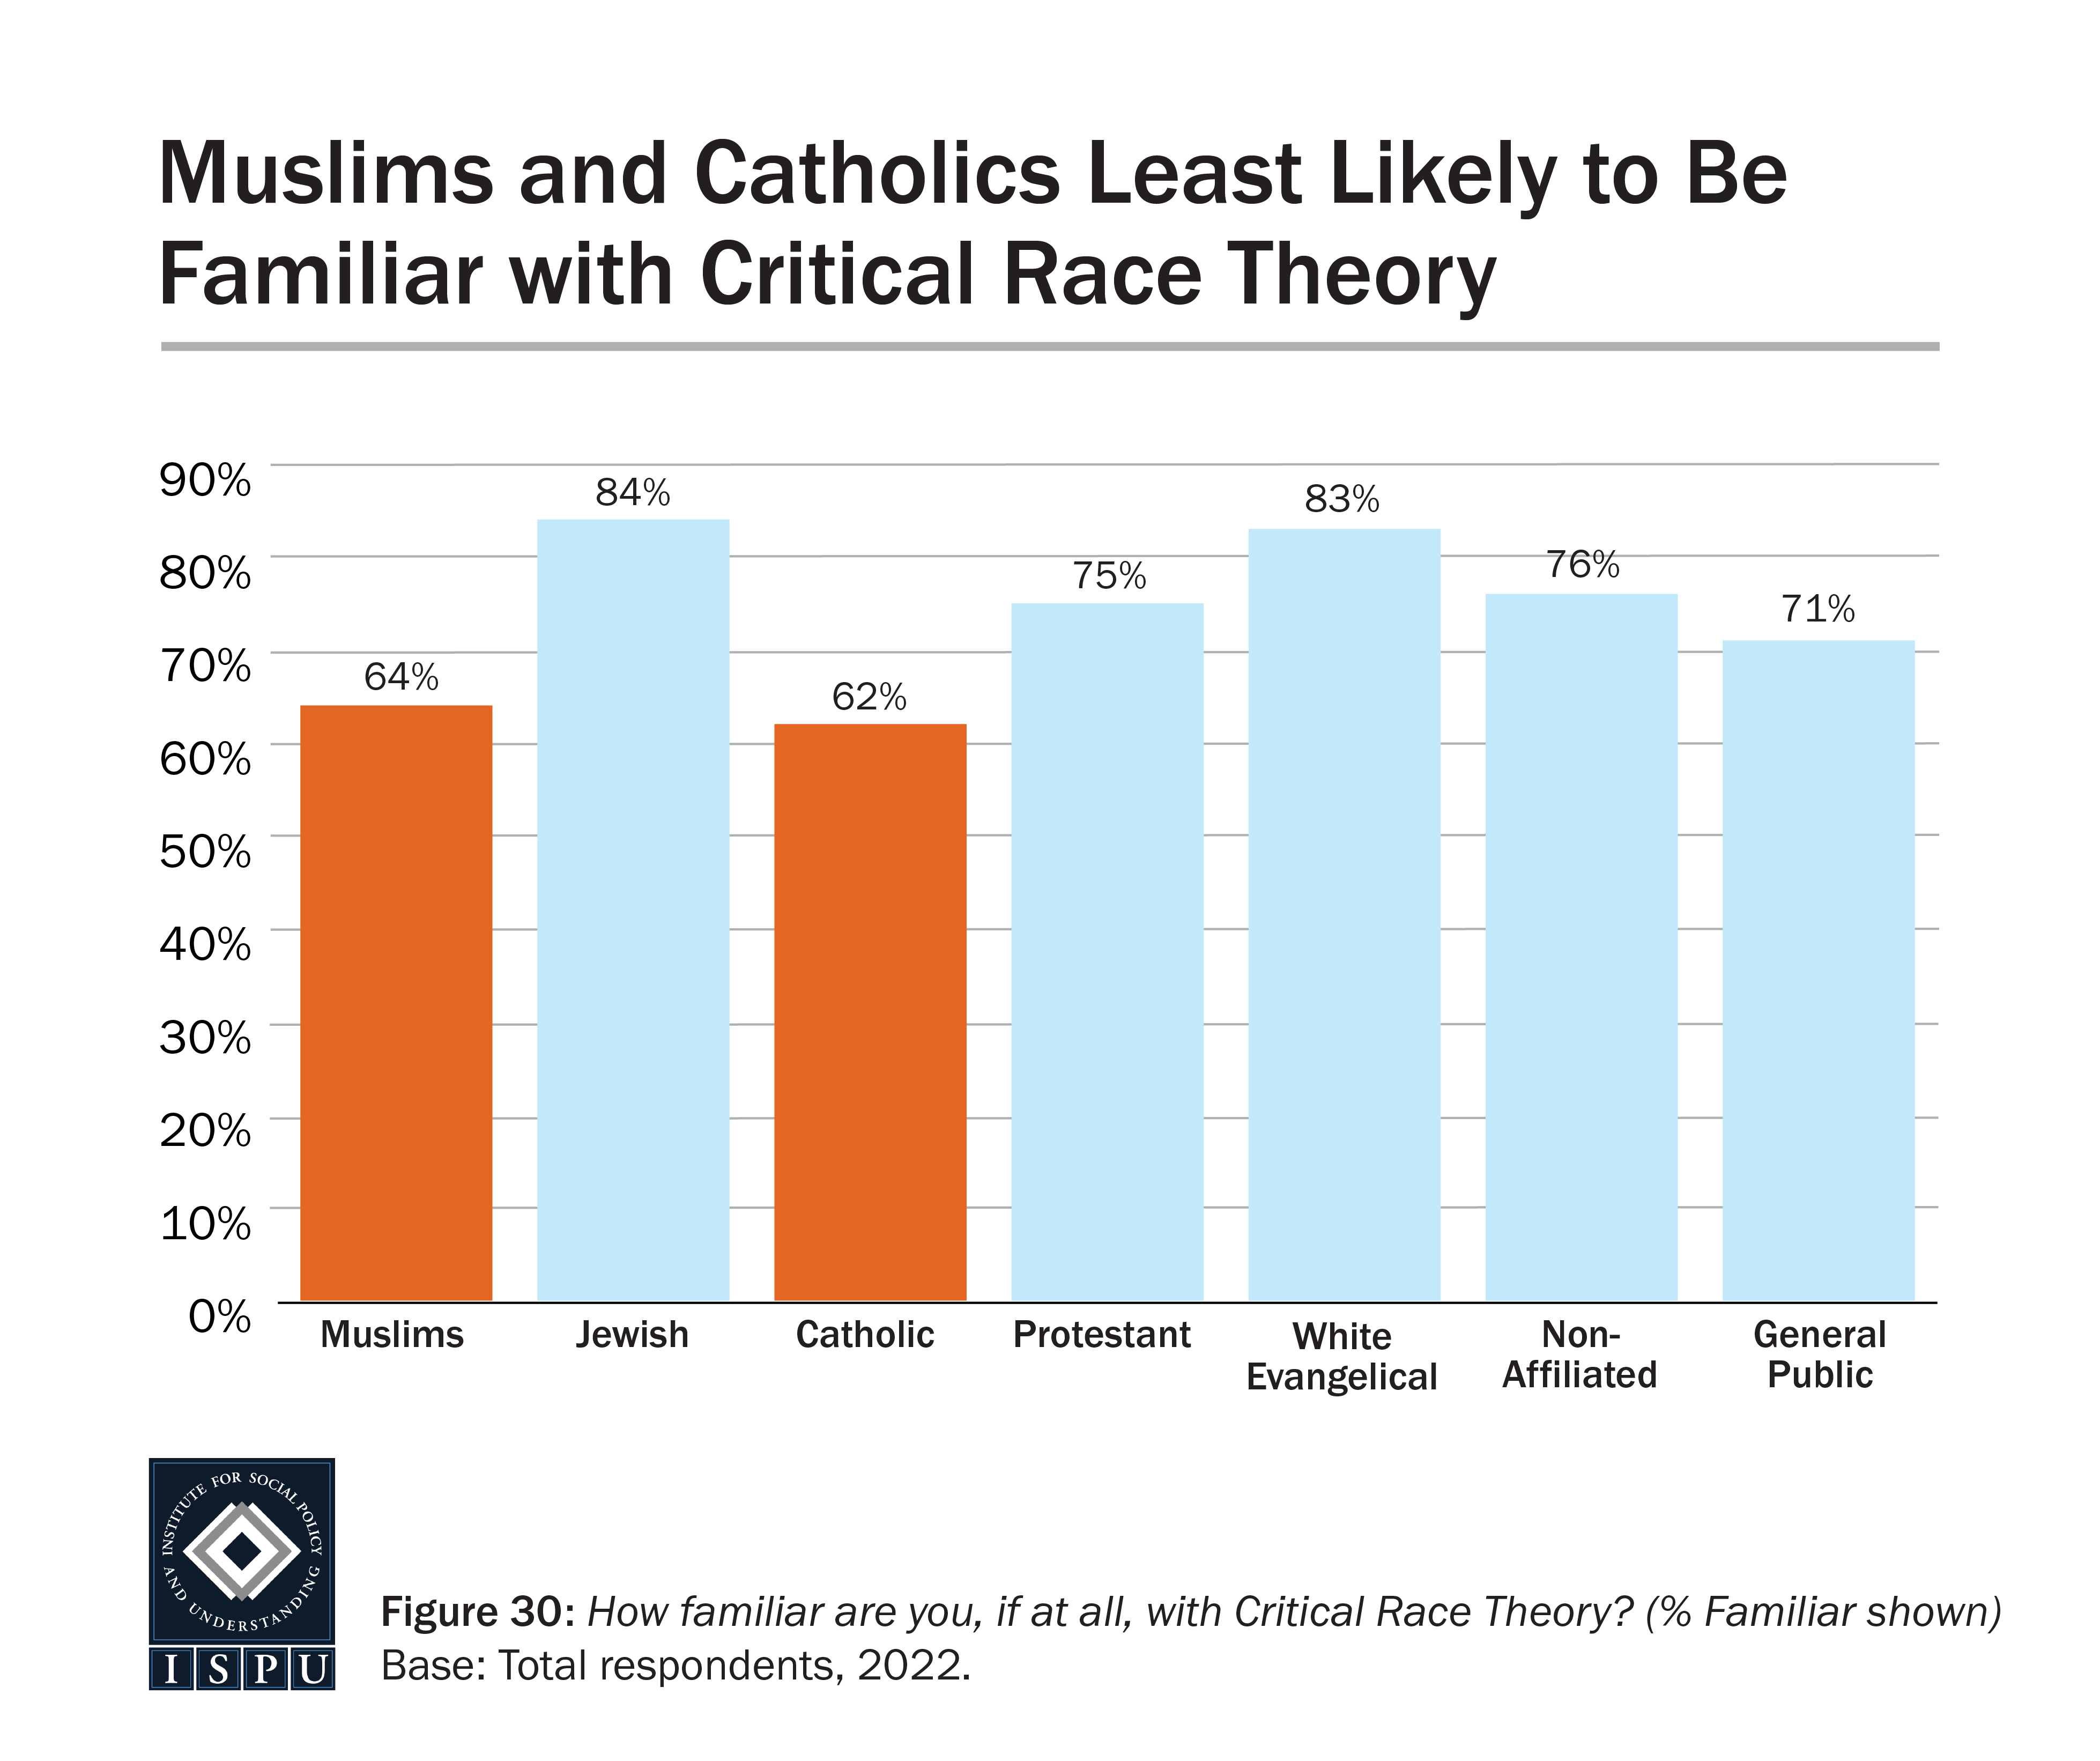
When it comes to level of familiarity with CRT, Muslims and Catholics (64% and 62%, respectively) are least likely to say they are familiar. On the other hand, Jews (84%) and white Evangelicals (83%) are the most familiar.
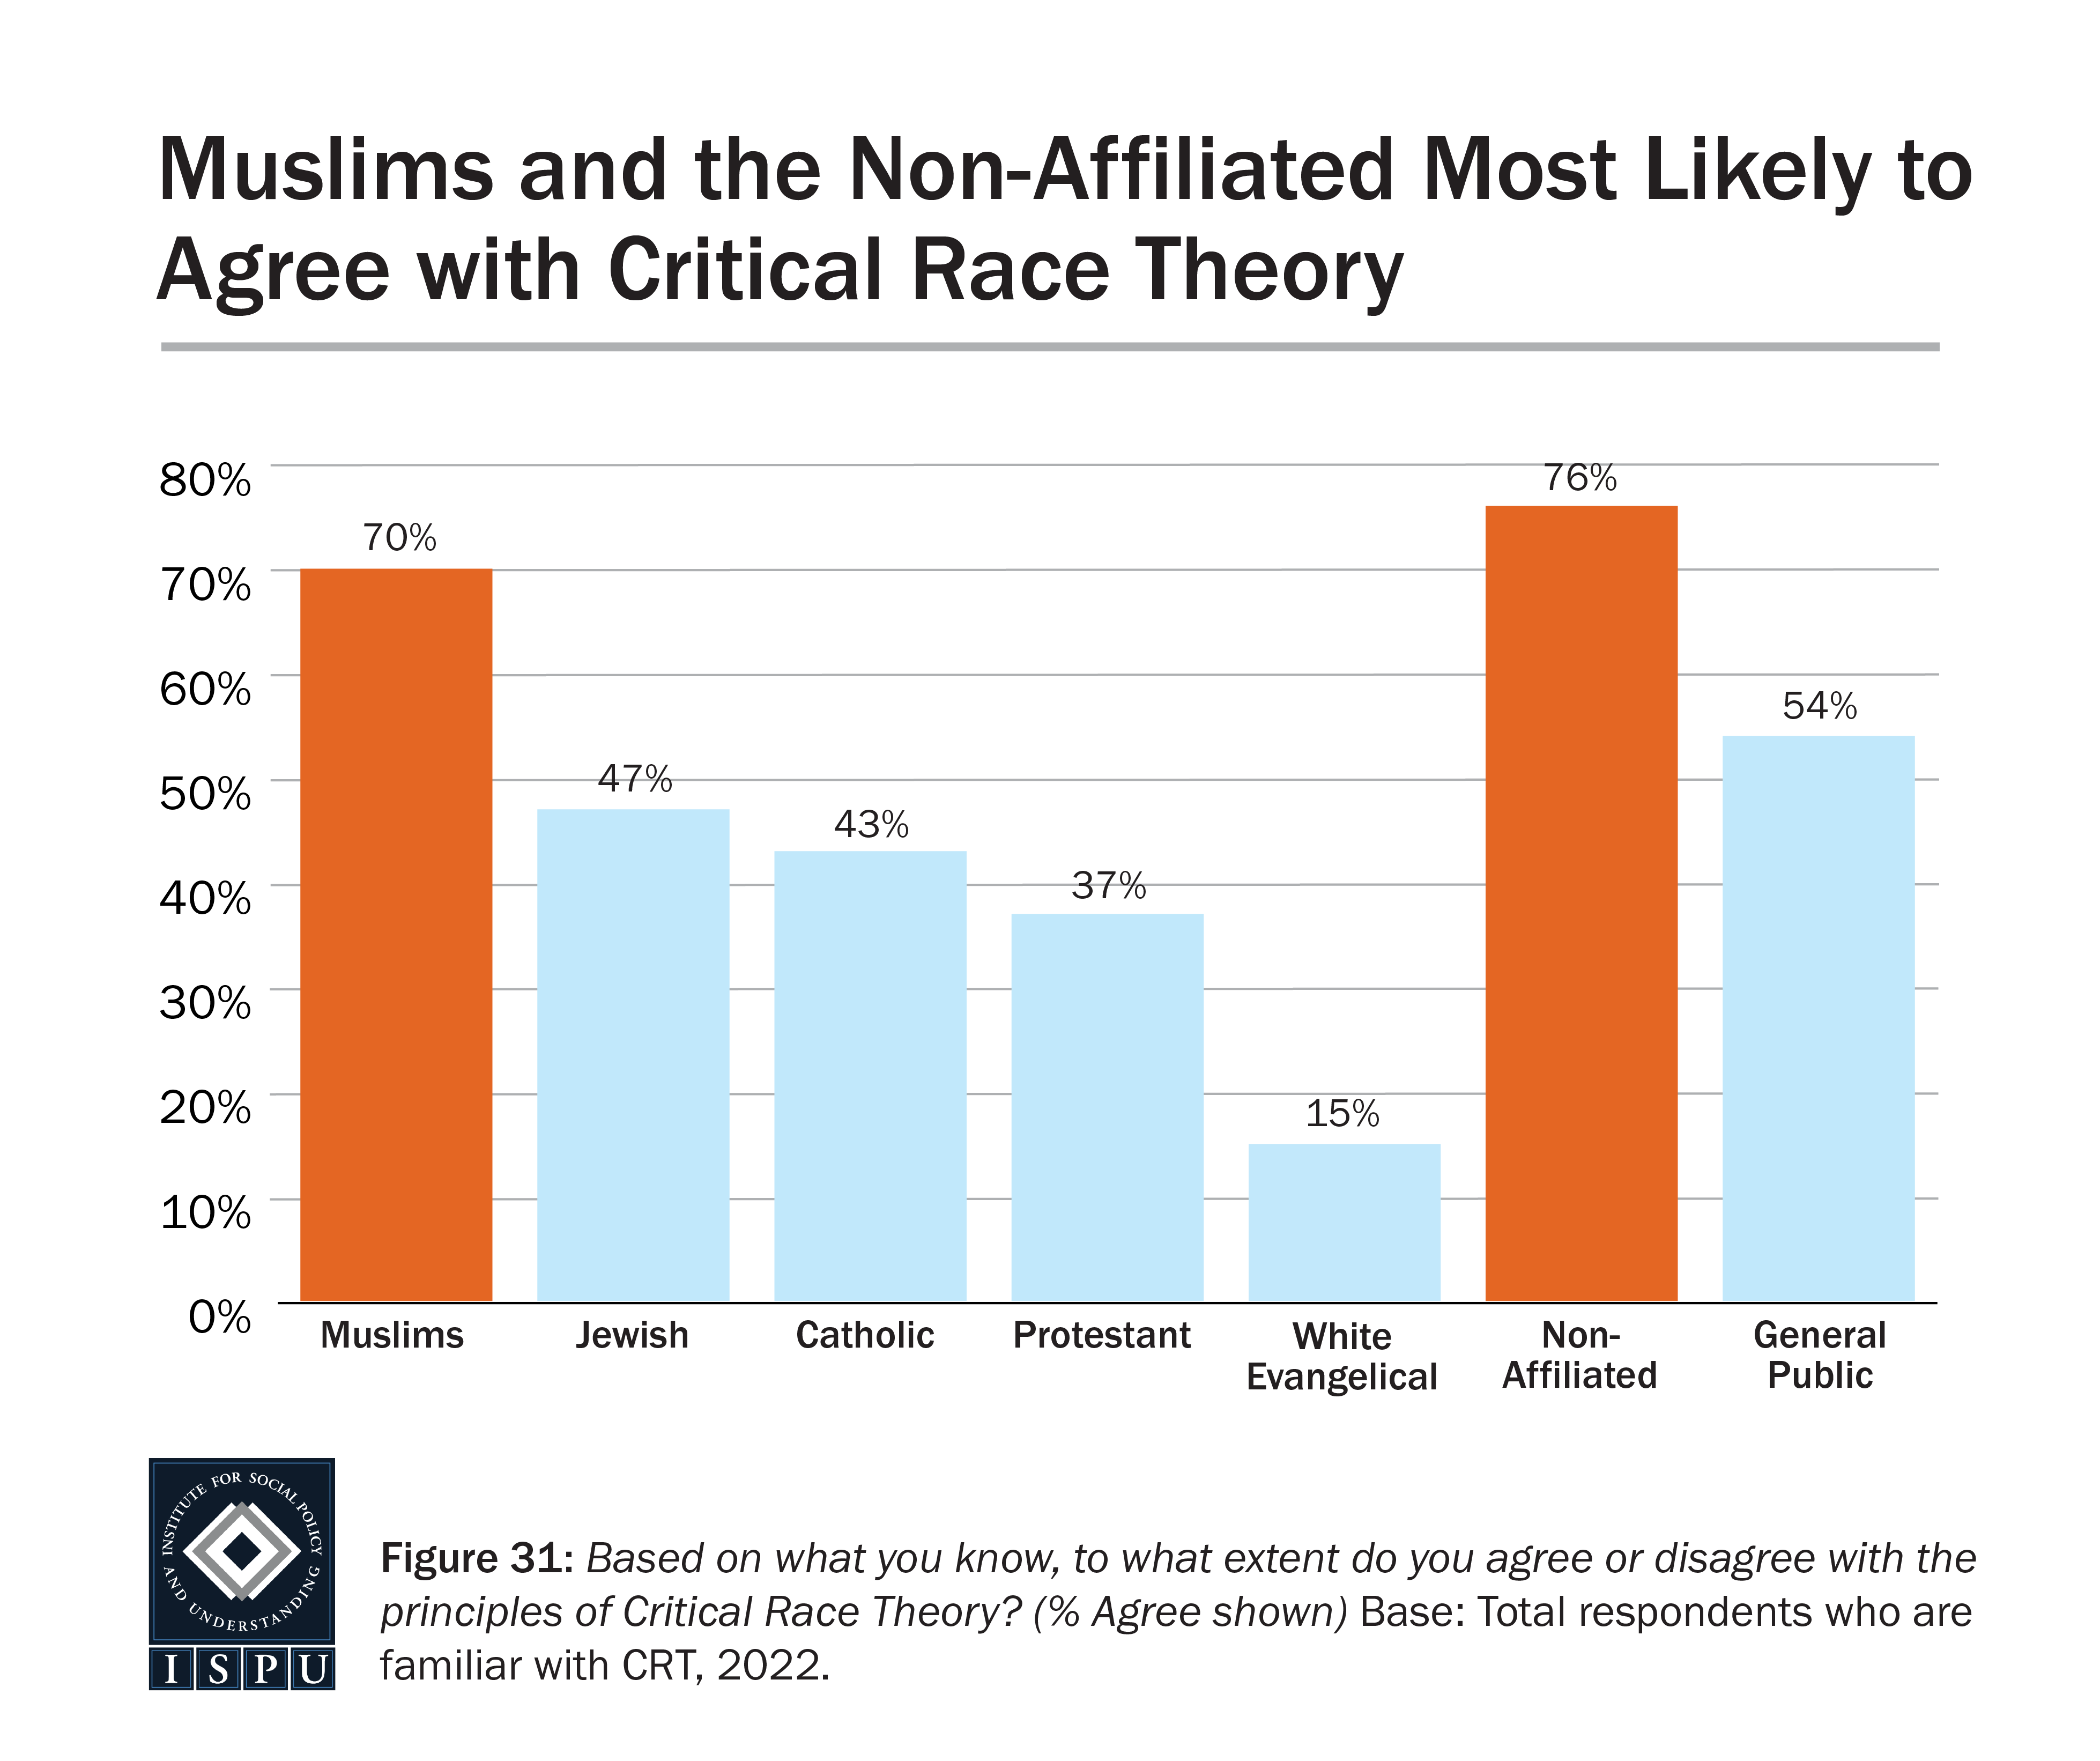
As a follow-up question, we asked those who expressed familiarity with CRT about their level of agreement with the principles of CRT. Among those familiar with CRT, Muslims (70%) and the nonaffiliated (76%) are more likely than others to express agreement with its principles. This is significantly higher than Jews (47%), Catholics (43%), Protestants (37%), white Evangelicals (15%), and the general public (54%). Muslim men and women were equally likely to agree with the principles of CRT, as were men and women across all other groups except Protestants. Among Protestants, women were more likely than men to agree with the principles of CRT (43% vs. 26%, respectively).
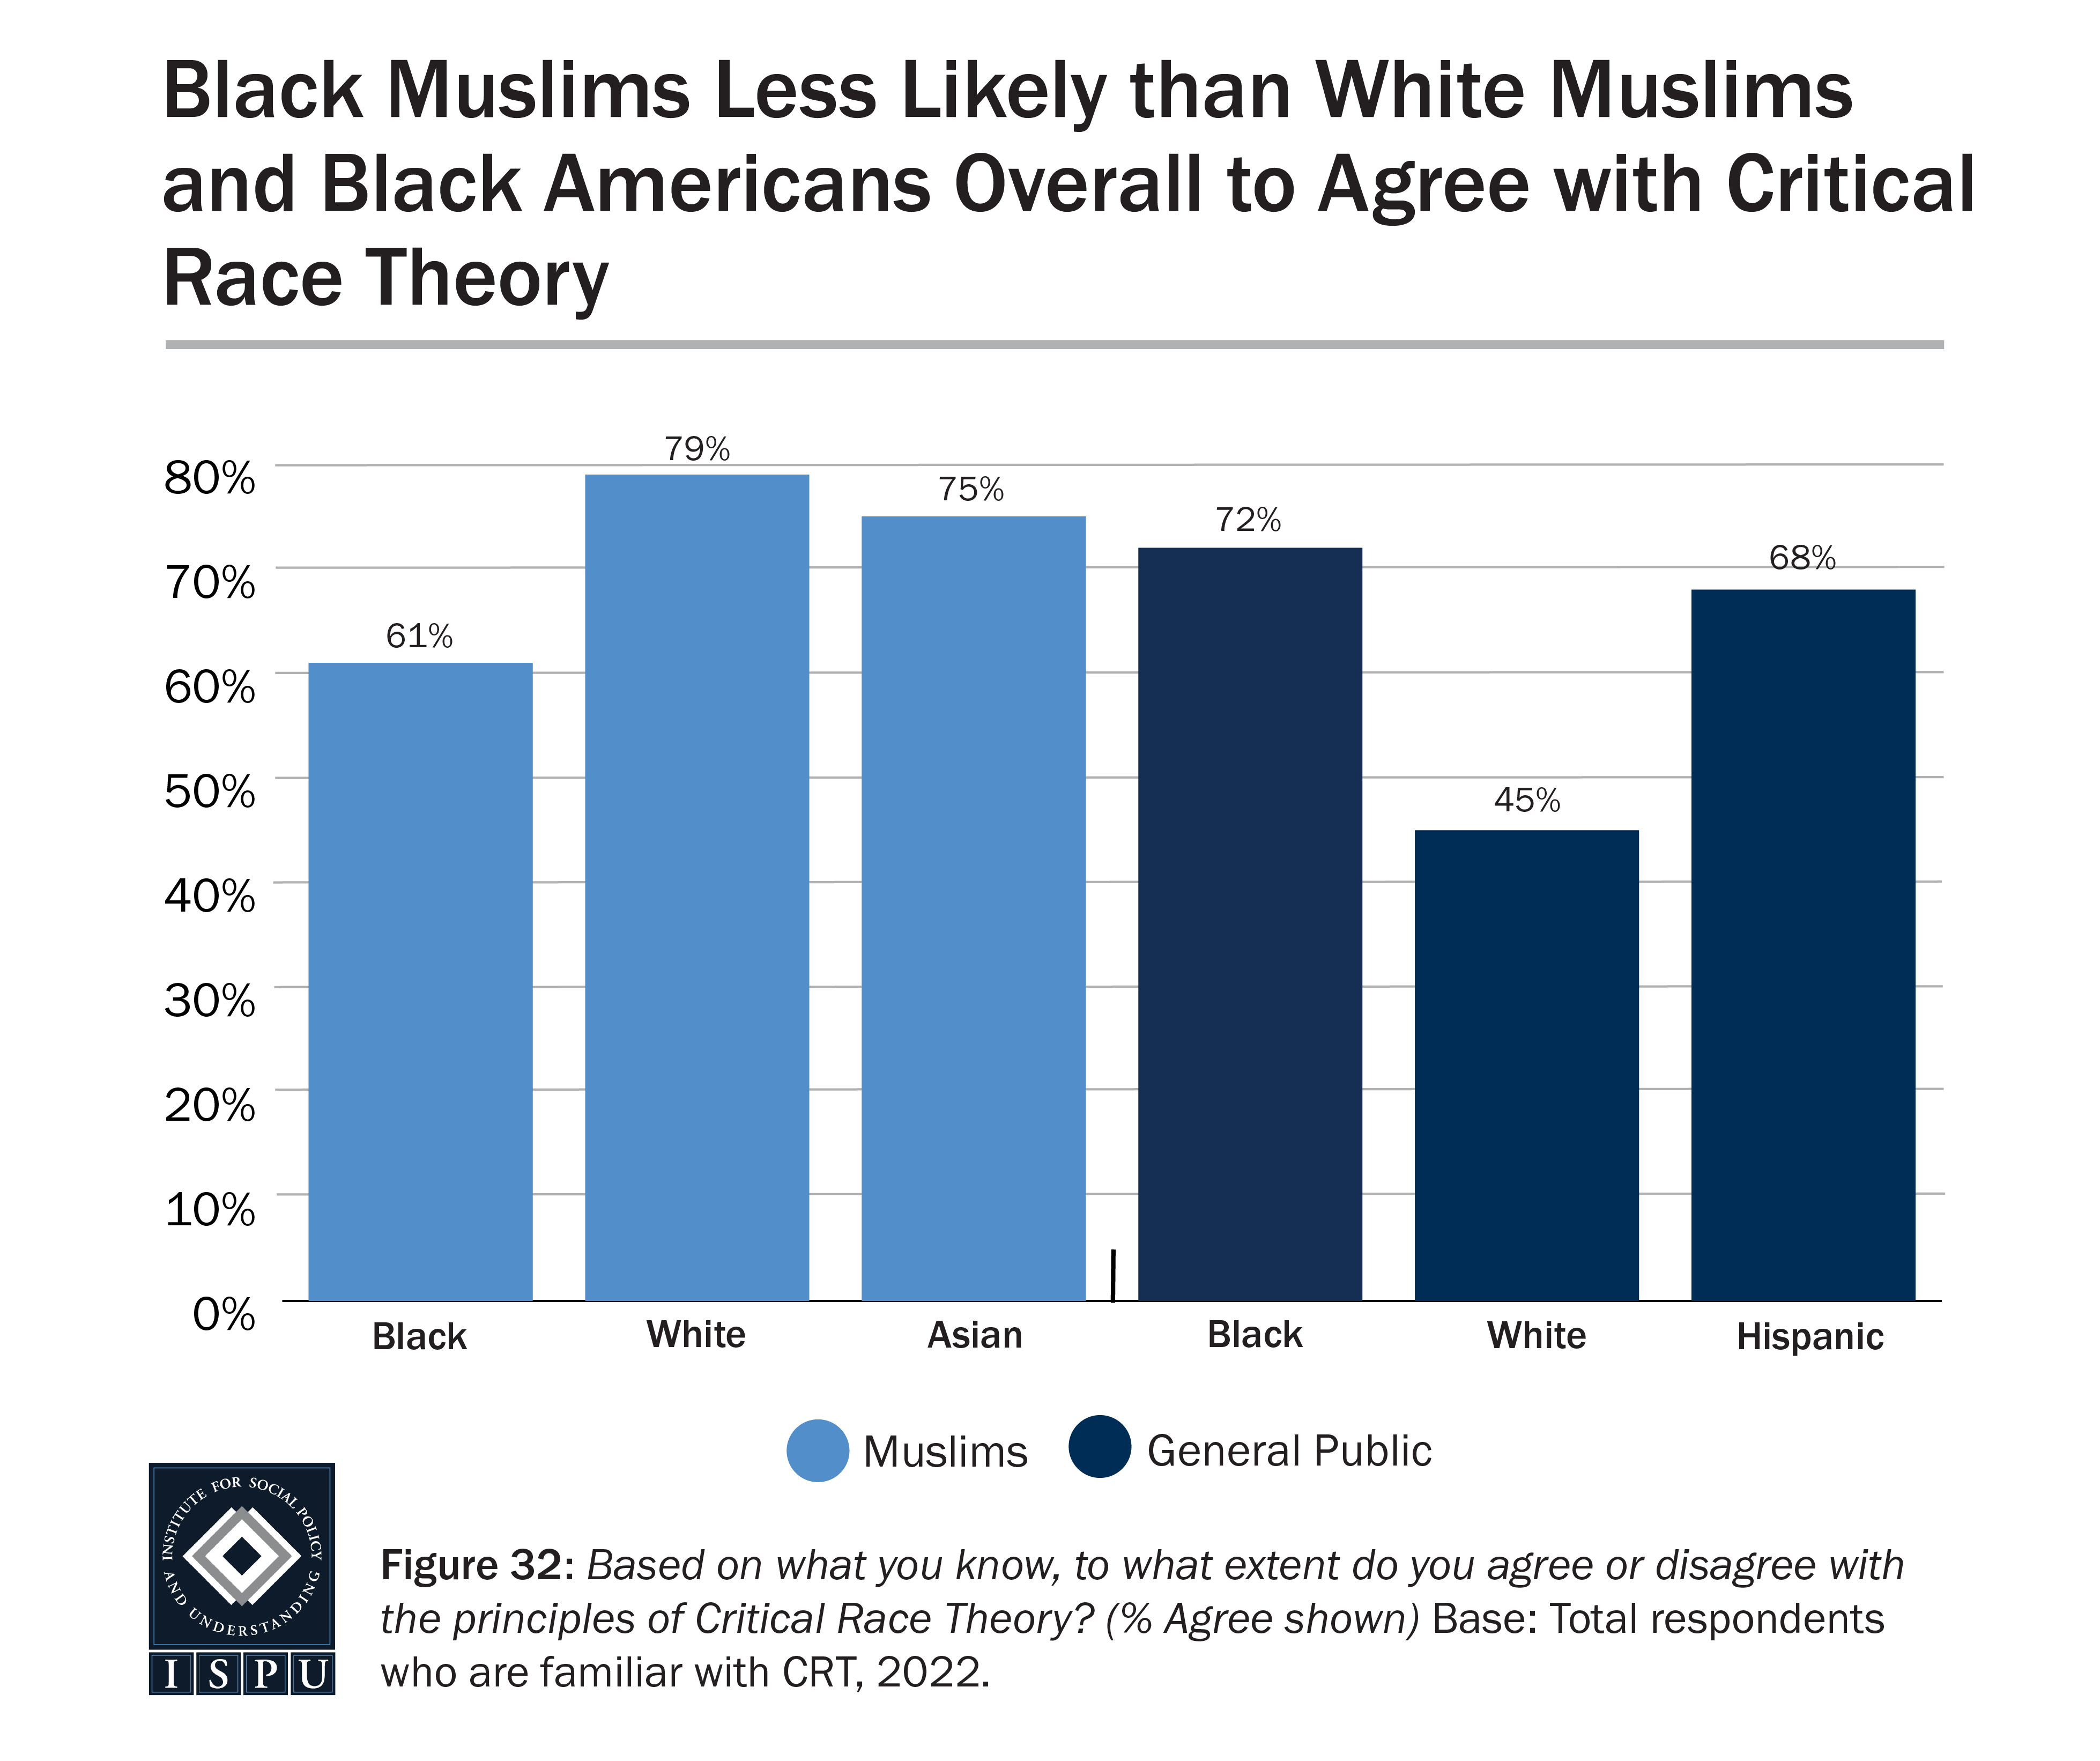
Looking by race, white Muslims (74%) are more likely than Asian (59%) and Arab (51%) Muslims to say they are familiar with CRT. Two-thirds of Black Muslims (66%) report familiarity with CRT, on par with white Muslims. Among those who are familiar with CRT, white Muslims (79%) are more likely than Black Muslims (61%) to agree with its principles. Asian (75%) Muslims are on par with white Muslims. Comparing between Muslims and the general public by race, Black Muslims (61%) are less likely than Black Americans in the general public (72%) to agree with the principles of CRT, while white Muslims (79%) are more likely than whites in the general public (45%) to agree. Sample sizes for Arab Muslims who were familiar with CRT were too small to report.
Racial tensions continue to challenge Muslim communities, just as they do the rest of America. Though Muslims overall, especially non-Black Muslims, express support for popular movements and ideas associated with racial equity like Black Lives Matter and CRT, this support must be a foundation for more intra-Muslim conversations about race and not the final word. If Black Muslims are less likely to agree with the principles of CRT, do they see support for these movements as meaningful to Muslim anti-racism? What would authentic Muslim anti-racism look like? These are the questions that must be discussed across Muslim communities to continue the work of racial healing.


