.
Illinois Muslims
Needs, Assets, and Opportunities
JULY 28, 2022 | BY DALIA MOGAHED, DR. JOSEPH HOERETH, OJUS KHANOLKAR, AND UMAIR TARBHAI

Introduction
Illinois is home to a large and diverse community of Muslims, with the most recent available estimates placing the size at around 2,800 Muslims per 100,000 Illinoisans [5]. Given that there are around 12.5 million people in Illinois according to the 2020 census, that means at least 350,000 residents who self-identify as Muslims call Illinois home.

Despite being home to one of the larger populations of Muslims in America, there has never been an evidence-based portrait of this vibrant and diverse community statewide nor an assessment of their needs and opportunities. This report seeks to do just that.
Amidst the backdrop of a pandemic that disproportionately affects minority communities, systemic racial inequities, and an election year amidst widespread economic hardships, 2022 brings urgency to this initiative. Understanding the needs of diverse residents is critical for policy makers, social service agencies, businesses, employers, funders, journalists, and others.
Evidence-based decisions are vitally important. Quality research informs effective public, social, public health, and business policies. It enables smart activism, advocacy and community development programs and promotes fact-based versus fear-based decision-making and nuanced and accurate media reporting. Modeled after ISPU’s Bay Area Study, this research examines the needs, challenges, opportunities, and demographics of Illinois’ Muslim residents. The evidence-based portrait will help those working to strengthen our communities and build a more just and equitable Illinois, impacting philanthropic, social, civic, faith, public health, and business outcomes for decades. Researchers can use this report as a place to forge further research, and the general public can use this as an easy tool to understand an established and ever-growing population.
This research study is a collaboration between The Institute for Policy and Civic Engagement (IPCE) at the University of Illinois Chicago and the Institute for Social Policy and Understanding (ISPU), convened by the IL Muslim Civic Coalition (the Coalition) and its partners and allies across the region. This study is 100% funded by the generous contributions of Muslim community members and organizations.
This research builds on the important work of previous scholars. The last demographic survey on Muslims in Illinois was conducted in 1997 by Professor Ilyas Ba-Yunus. This predated the spread of online questionnaires but had a similar methodology to the present study, using snowball sampling within the city of Chicago and the surrounding suburbs and engaging Muslims who lived outside the Chicago metropolitan area by partnering with community centers, social service and civic organizations, and individual influencers across Illinois. Professor Ba-Yunus and the researchers acknowledged that his sample underrepresented African American Muslims. In addition, his team acknowledged that their focus was mainly on demographic qualities of the Muslim population. The researchers of the previous study did not look at attitudes and perceptions within the Muslim community nor did it closely examine the needs and assets of these communities. Our present study is therefore the first of its kind. We aim to conduct regular updates to this study over the years to provide stronger data and analysis.
DOWNLOADS
TABLE OF CONTENTS:
Page 1: Executive Summary, Report Overview
Page 2: Introduction, Results: Demographics
Page 3: Results: Individual
Page 4: Results: Family, Results: Community
Page 5: Results: Broader Society, Recommendations and Opportunities
DOWNLOADS
Full ReportKey Findings
Illinois Muslims: Additional Resources

TABLE OF CONTENTS:
Page 1: Executive Summary, Report Overview
Page 2: Introduction, Results: Demographics
Page 3: Results: Individual
Page 4: Results: Family, Results: Community
Page 5: Results: Broader Society, Recommendations and Opportunities
Introduction
Illinois is home to a large and diverse community of Muslims, with the most recent available estimates placing the size at around 2,800 Muslims per 100,000 Illinoisans [5]. Given that there are around 12.5 million people in Illinois according to the 2020 census, that means at least 350,000 residents who self-identify as Muslims call Illinois home.
Despite being home to one of the larger populations of Muslims in America, there has never been an evidence-based portrait of this vibrant and diverse community statewide nor an assessment of their needs and opportunities. This report seeks to do just that.
Amidst the backdrop of a pandemic that disproportionately affects minority communities, systemic racial inequities, and an election year amidst widespread economic hardships, 2022 brings urgency to this initiative. Understanding the needs of diverse residents is critical for policy makers, social service agencies, businesses, employers, funders, journalists, and others.
Evidence-based decisions are vitally important. Quality research informs effective public, social, public health, and business policies. It enables smart activism, advocacy and community development programs and promotes fact-based versus fear-based decision-making and nuanced and accurate media reporting. Modeled after ISPU’s Bay Area Study, this research examines the needs, challenges, opportunities, and demographics of Illinois’ Muslim residents. The evidence-based portrait will help those working to strengthen our communities and build a more just and equitable Illinois, impacting philanthropic, social, civic, faith, public health, and business outcomes for decades. Researchers can use this report as a place to forge further research, and the general public can use this as an easy tool to understand an established and ever-growing population.
This research study is a collaboration between The Institute for Policy and Civic Engagement (IPCE) at the University of Illinois Chicago and the Institute for Social Policy and Understanding (ISPU), convened by the IL Muslim Civic Coalition (the Coalition) and its partners and allies across the region. This study is 100% funded by the generous contributions of Muslim community members and organizations.
This research builds on the important work of previous scholars. The last demographic survey on Muslims in Illinois was conducted in 1997 by Professor Ilyas Ba-Yunus. This predated the spread of online questionnaires but had a similar methodology to the present study, using snowball sampling within the city of Chicago and the surrounding suburbs and engaging Muslims who lived outside the Chicago metropolitan area by partnering with community centers, social service and civic organizations, and individual influencers across Illinois. Professor Ba-Yunus and the researchers acknowledged that his sample underrepresented African American Muslims. In addition, his team acknowledged that their focus was mainly on demographic qualities of the Muslim population. The researchers of the previous study did not look at attitudes and perceptions within the Muslim community nor did it closely examine the needs and assets of these communities. Our present study is therefore the first of its kind. We aim to conduct regular updates to this study over the years to provide stronger data and analysis.
Methodology
This research involved two components; an in-depth survey and focus groups. Fielding the survey was the first step. With inspiration from the Bay Area study, a total of 74 questions were prepared in the following topic areas:
-
- Healthcare Access
- Mental Health
- Political and Civic Engagement
- Drug Abuse
- Poverty and Inequality
- Discrimination
- Bullying
- Inclusion
- Importance of Faith
- Philanthropy
- General Demographics
The questions were gathered from various sources such as census questionnaires, ISPU’s bank of questions, community leaders, and other verified sources. Due to the pandemic, the entire questionnaire was created and fielded online through Qualtrics, and then a link to the survey was distributed to Muslims across various email databases and shared through new and existing networks by the Coalition and ISPU. A total of 1,760 individuals identifying as Muslim responded to the survey. This is a strong number of responses, almost twice what was expected by researchers. In an effort to engage Muslims across ethnicities and English language abilities, the survey was made available in eight different languages in Qualtrics: English, Bosnian, Urdu, French, Spanish, Turkish, Farsi, and Arabic. Each week, the results were reviewed, and basic demographic statistics were collected about the population that filled out the survey that week. The survey was kept open from October 10, 2021, to February 9, 2022. See Appendix A for a copy of the survey.
For the basis of comparison, we fielded the same survey to a sample of the Illinois general public from November 18, 2021, to December 1, 2021. A non-probability sample of 820 Illinois residents aged 18 or older was sourced from Qualtrics, a leading online survey company. We used demographic quotas based on Census Population Study (CPS) data for Illinois. Based on this: 22% identified as Hispanic and 20% identified as Black; in terms of educational attainment, 28% had a college degree or higher. The general public sample also reflected the state’s partisan breakdown; the sample was 34% Republican, 58% Democrat, and 8% Independent.
The survey data was cleaned and analyzed using the R programming language. For each question, cross-tables were created by race, gender, and age. For the Muslim sample, the race cross-tabs consisted of white, Black, Asian, and Arab, while the race cross-tabs for the Illinois general public sample were white, Black, and Hispanic. Small sample sizes prevented the use of additional cross-tabs in this analysis. Chi-squared testing was done to determine the significance of these findings. Totals may not add to 100% due to rounding. See Appendix B for top-line results.
Focus group questions expanded on the topics within the survey, such as inter-ethnic Muslim unity, community relationships (especially with non-Muslims), faith and leadership, mental health, civic engagement, and access to halal food and services. A google form was created and posted to various online groups and networks to recruit focus group participants, with a maximum of eight participants per focus group.
The focus groups were conducted the week before the start of Ramadan, from Tuesday, March 22 to Friday, March 25. Four focus groups were held—two with Muslim respondents of any age, race or ethnicity, one with African American Muslims only, and one with young adults aged 18-29. Each focus group comprised a moderator who asked questions and moderated the discussion between the participants and a notetaker who transcribed the notes verbatim.
By race/ethnicity, across all four focus groups, we had one Bosnian participant, one African participant, three South Asian participants, one Malay participant, 10 African American participants, and one white American participant. Some participants were not comfortable sharing their ages, yet among those who disclosed their ages, nine individuals were aged 18-29, three were 30-49, and four were 50 or over.
Addressing Sample Limitations
In any research there are limitations to comparing two sets of data. One set of constraints was unique to the context of fielding a survey during the COVID-19 pandemic, which limited the range of options. Additionally, the need to compare the Illinois Muslim survey respondent group to the public at-large in Illinois has limitations, particularly in how any differences can be interpreted. Per consultation with SSRS, a respected independent research and data analytics firm, “the challenge with non-probability samples like our Illinois general public sample is that there is no theoretical basis for assuming that the sample would look the same the next time it is drawn, which is the theoretical basis of the statistical testing. However, in market research, non-probability samples are used regularly for a variety of valid reasons and use many of the same statistical tools to understand that data, including margins of error and statistical testing.” Following that convention, we conducted statistical testing to indicate where differences between how the two survey respondents answered were unlikely to be due to chance.
This survey used an outreach method referred to as “snowball” sampling, which is helpful for generating a large sample size but can make achieving representation difficult. To account for this anticipated challenge, the research team monitored the demographic mix of the sample as surveys came in and targeted outreach to African American and African immigrant Muslim communities through trusted leaders and influencers. The fielding period was also extended two full months in an effort to maximize representativeness. At the close of the survey, the raw survey results included an overrepresentation of Asian individuals and an underrepresentation of African Americans. This was addressed by dedicating a specific focus group to the perspectives of African American Muslims and through the statistical process of “weighting” the data to smooth out some unevenness in representation. Despite these steps, it is recognized that future surveys and research will need to make additional steps to ensure true representativeness is achieved.
The collected sample also skewed toward wealthier respondents. As noted, this was anticipated for the “snowball” method used in this study. This is mitigated by weighting the data, a complex process that mathematically adjusts the data to account for relative imbalances in the respondent mix to better match the mix of respondents with the demographics of the general population in Illinois. The weighting was done by SSRS, a respected independent research and data analytics firm, who weighted the data by gender, age, and education (see Appendix C for further detail). Weighting the data by race was not possible due to differences in the way the question about race was asked in the Muslim survey and how it was asked in the census.
.

Results: Demographics
The 74-question survey with nearly 1,800 respondents resulted in a large volume of data. Tables 1 and 2 below summarize who responded to the survey, including the demographics of the respondent sample. The actual question responses are summarized in the subsections that follow: Demographics “Young and Diverse,” questions pertaining to the individual respondent (Individual), questions about the respondent family (Family), questions pertaining to the Muslim community (Community), and questions regarding perspectives beyond the Muslim community (Broader Society).
Report Partners
This research was convened by the IL Muslim Civic Coalition and partners and conducted by the Institute for Policy and Civic Engagement at the University of Illinois Chicago (IPCE) and the Institute for Social Policy and Understanding (ISPU).


Demographics: Young and Diverse
Respondents were relatively young and diverse across a broad range of demographic and socioeconomic factors. Over half (58%) of the Muslim sample was comprised of men while 38% of the Illinois general public sample was comprised of men. It is typically found that women respond to surveys more than men, so the slight overrepresentation of men in this sample is an interesting deviation from the norm.
The Illinois Muslim sample was on average younger than the state’s general public, with 50% of the Muslim sample between 18 and 35, compared to 42% of the general public. The general public is also roughly twice as likely as the Muslim sample to be over the age of 56 (29% vs. 15%).

In terms of racial breakdown, the Muslim sample consisted of 50% Asian Muslim, 21% white Muslim, 17% Arab Muslim, 6% African American Muslim, and 1% American Indian/Alaska Native Muslim. Latinos accounted for 2% of the Muslim sample. As previously noted, this is an underrepresentation of African Americans and an overrepresentation of Asian Americans. Estimates from SSRS [6], a nationally recognized polling firm, reveals the following racial/ethnic makeup of Illinois Muslims: 23% non-Hispanic white, 35% non-Hispanic Black, 8% Hispanic, 31% Asian, and 4% non-Hispanic other. It is important to note that these estimates did not include “Arab” as a racial/ethnic category, which is available in ISPU’s national representative American Muslim Poll. According to these representative national surveys, the racial representation of American Muslims is 27% African American or Black and 18% Asian.


Sixty-three percent of respondents in the Illinois Muslim sample spoke English at home. Fifteen percent of respondents stated that in addition to English, they spoke Arabic, while 9% responded that they speak Bosnian at home in addition to English. Four percent of the respondents stated they speak another language that wasn’t listed in our options, and 2% stated they speak Turkish at home in addition to English.

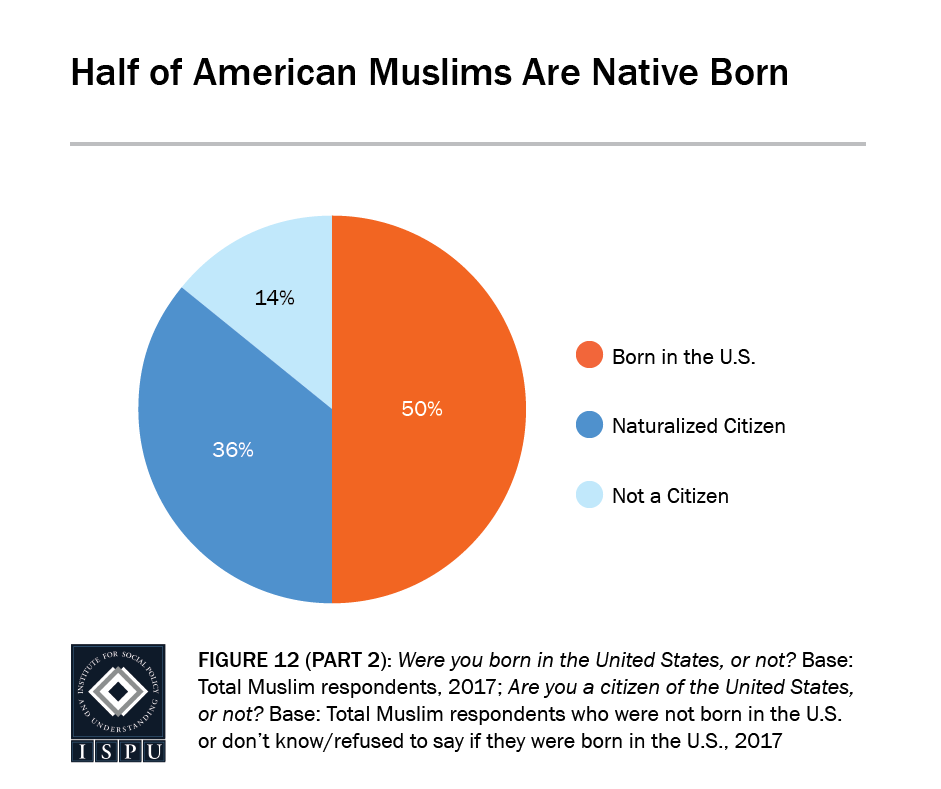
More than 50% of the Muslim sample was born in the United States, as opposed to 89% of the Illinois general public sample. That said, 92% of our Muslim sample is eligible to vote. This result mirrors ISPU’s national survey of Americans who are Muslim, where roughly half are native born and half are immigrants. In our Illinois Muslim sample, of those born in a different country, 50% were born in South Asia, 20% were born in the Middle East, 20% were born in Europe, 2% were born in Southeast Asia, and 7% were born in Africa. Despite self-identified Asians making up 50% of survey members born outside the United States, only 6% of all individuals spoke Urdu at home in addition to English.

In the Muslim sample, 92% of the respondents stated they were raised Muslim. Additionally, 1% were raised Protestant, 1% were raised agnostic, 2% were raised Roman Catholic, and 4% were raised in some other religion. Of the individuals who identify as Muslim, 69% identify as Sunni Muslim, 2% identify as Shiite Muslim, and 1% identify as either Sufi or Salafi. Fewer than 1% identify as either Ahmedi, Ismaili, or a member of the Nation of Islam. It is important to note that 26% of individuals referred to themselves as just Muslim, foregoing sub-religious identification.


In terms of education, 40% of respondents in the Muslim sample have a college degree or higher, compared with 28% of the Illinois general public sample. One-third (33%) of the Muslim sample and 42% of the Illinois general public have completed some college or a technical degree. Similar proportions of the Muslim sample and general public have graduated high school (22% and 26%, respectively). Among the Muslim sample, 6% had less than a high school education while 4% of the Illinois general public sample had less than a high school education.

Eight percent of respondents in the Muslim sample stated they have a disability. Nationally, one in three Muslims reports they or an immediate family member have a disability. Community leaders cannot afford to ignore the needs of this segment of any community and should start by listening to the impacted members to learn how faith spaces can better meet their needs.

Politically, 58% of the Muslim sample and the Illinois general public identify as Democratic, and 38% identify as independent, more likely than the general public in the state where only 8% claim this political description. As a community with a significant percentage identifying as “Independent,” Muslims in Illinois may be less tied to partisanship and more to principles when making political choices. It also opens opportunities for both parties to win over segments of the community. Among the Muslim sample, 4% identify as Republicans less likely than the Illinois general public (34%).

Among the Muslim sample, 3% of the Muslim sample identified as LGBTQ, compared to 13% of the Illinois general public sample.

In total, respondents in the Illinois Muslims sample reside in 22 counties in Illinois. Most of our participants (roughly 50%) came from Cook County, which consists of Chicago and the surrounding areas of Evanston, Schaumburg, Orland Park, and Tinley Park. Twenty-eight percent of respondents came from DuPage County, which comprises the suburbs of Naperville, Oak Brook, and Downers Grove. Eight percent came from Will County and 4% of respondents came from Lake County, which consists of North Chicago and Waukegan.

Notes
[5] https://worldpopulationreview.com/state-rankings/muslim-population-by-state
[6] Estimates from the SSRS polling firm are based on Multilevel Regression and Poststratification (MRP) estimates using data from several sources collected across multiple years, including the 2019 American Community Survey, the SSRS weekly telephone Omnibus (2019 to 2021), and the SSRS Opinion Panel (2015 to 2022).